Immigrants from Taiwan vs Ecuadorian Child Poverty Among Girls Under 16
COMPARE
Immigrants from Taiwan
Ecuadorian
Child Poverty Among Girls Under 16
Child Poverty Among Girls Under 16 Comparison
Immigrants from Taiwan
Ecuadorians
11.3%
CHILD POVERTY AMONG GIRLS UNDER 16
100.0/ 100
METRIC RATING
2nd/ 347
METRIC RANK
18.8%
CHILD POVERTY AMONG GIRLS UNDER 16
0.7/ 100
METRIC RATING
244th/ 347
METRIC RANK
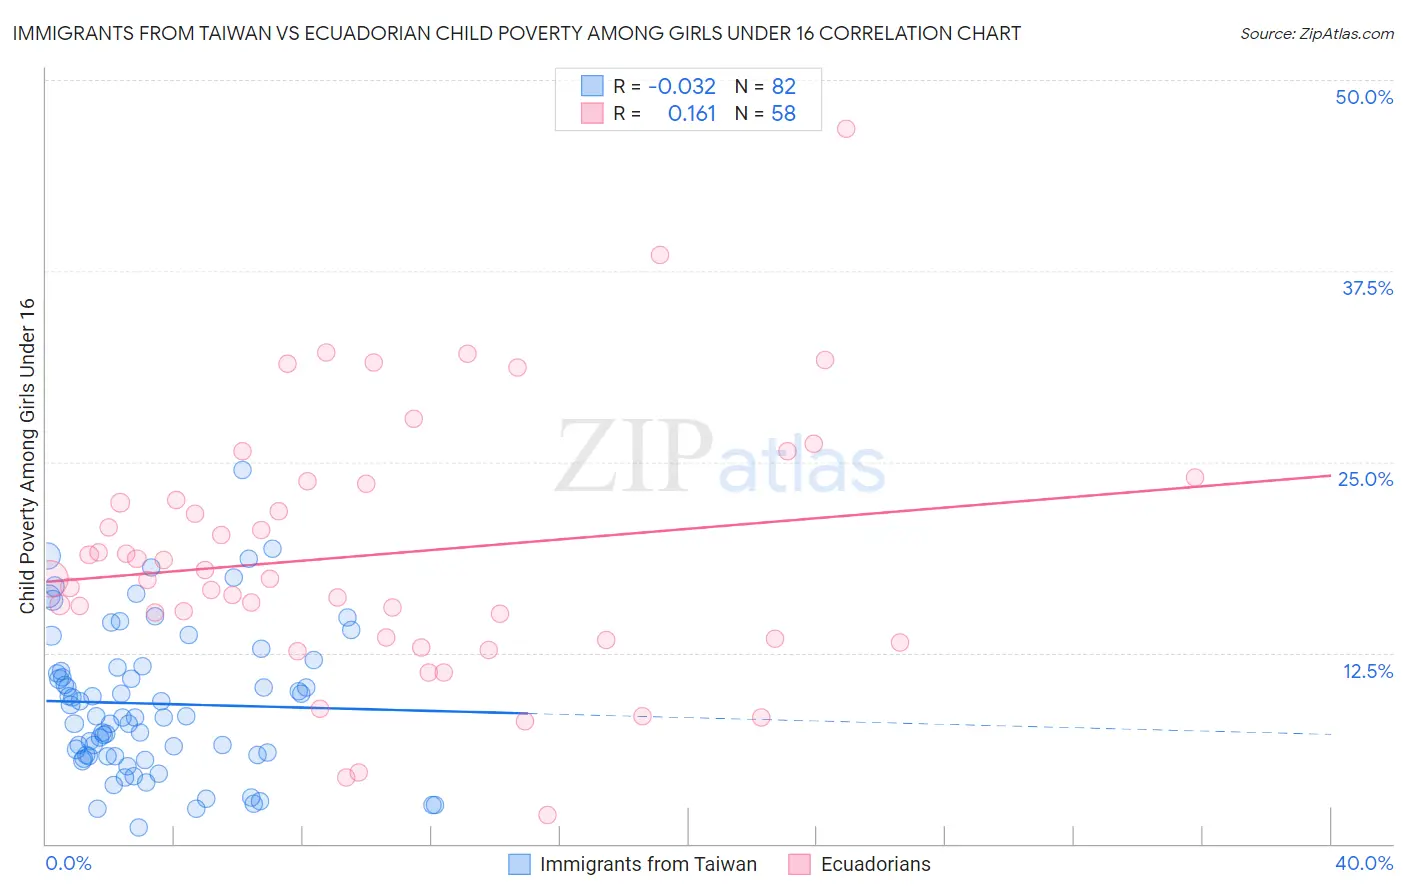
Immigrants from Taiwan vs Ecuadorian Child Poverty Among Girls Under 16 Correlation Chart
The statistical analysis conducted on geographies consisting of 293,199,111 people shows no correlation between the proportion of Immigrants from Taiwan and poverty level among girls under the age of 16 in the United States with a correlation coefficient (R) of -0.032 and weighted average of 11.3%. Similarly, the statistical analysis conducted on geographies consisting of 313,275,748 people shows a poor positive correlation between the proportion of Ecuadorians and poverty level among girls under the age of 16 in the United States with a correlation coefficient (R) of 0.161 and weighted average of 18.8%, a difference of 66.5%.
Child Poverty Among Girls Under 16 Correlation Summary
| Measurement | Immigrants from Taiwan | Ecuadorian |
| Minimum | 1.1% | 1.9% |
| Maximum | 24.4% | 46.8% |
| Range | 23.4% | 44.9% |
| Mean | 9.2% | 18.9% |
| Median | 8.3% | 17.3% |
| Interquartile 25% (IQ1) | 5.8% | 13.4% |
| Interquartile 75% (IQ3) | 11.5% | 23.5% |
| Interquartile Range (IQR) | 5.7% | 10.1% |
| Standard Deviation (Sample) | 4.8% | 8.5% |
| Standard Deviation (Population) | 4.7% | 8.4% |
Similar Demographics by Child Poverty Among Girls Under 16
Demographics Similar to Immigrants from Taiwan by Child Poverty Among Girls Under 16
In terms of child poverty among girls under 16, the demographic groups most similar to Immigrants from Taiwan are Filipino (11.4%, a difference of 0.87%), Tsimshian (11.5%, a difference of 1.4%), Immigrants from India (11.0%, a difference of 2.6%), Thai (11.8%, a difference of 4.5%), and Immigrants from Hong Kong (12.3%, a difference of 8.9%).
| Demographics | Rating | Rank | Child Poverty Among Girls Under 16 |
| Immigrants | India | 100.0 /100 | #1 | Exceptional 11.0% |
| Immigrants | Taiwan | 100.0 /100 | #2 | Exceptional 11.3% |
| Filipinos | 100.0 /100 | #3 | Exceptional 11.4% |
| Tsimshian | 100.0 /100 | #4 | Exceptional 11.5% |
| Thais | 100.0 /100 | #5 | Exceptional 11.8% |
| Immigrants | Hong Kong | 100.0 /100 | #6 | Exceptional 12.3% |
| Chinese | 100.0 /100 | #7 | Exceptional 12.3% |
| Iranians | 100.0 /100 | #8 | Exceptional 12.4% |
| Immigrants | Singapore | 100.0 /100 | #9 | Exceptional 12.5% |
| Immigrants | Iran | 100.0 /100 | #10 | Exceptional 12.6% |
| Immigrants | South Central Asia | 100.0 /100 | #11 | Exceptional 12.7% |
| Bhutanese | 100.0 /100 | #12 | Exceptional 12.7% |
| Immigrants | Ireland | 99.9 /100 | #13 | Exceptional 12.9% |
| Burmese | 99.9 /100 | #14 | Exceptional 13.0% |
| Okinawans | 99.9 /100 | #15 | Exceptional 13.0% |
Demographics Similar to Ecuadorians by Child Poverty Among Girls Under 16
In terms of child poverty among girls under 16, the demographic groups most similar to Ecuadorians are Immigrants from Nicaragua (18.8%, a difference of 0.070%), Shoshone (18.9%, a difference of 0.12%), Immigrants from Laos (18.9%, a difference of 0.14%), Immigrants from Cuba (18.8%, a difference of 0.28%), and American (18.8%, a difference of 0.43%).
| Demographics | Rating | Rank | Child Poverty Among Girls Under 16 |
| Immigrants | Nigeria | 1.0 /100 | #237 | Tragic 18.6% |
| Immigrants | Eritrea | 1.0 /100 | #238 | Tragic 18.7% |
| Marshallese | 0.9 /100 | #239 | Tragic 18.7% |
| Nigerians | 0.9 /100 | #240 | Tragic 18.7% |
| Americans | 0.8 /100 | #241 | Tragic 18.8% |
| Immigrants | Cuba | 0.7 /100 | #242 | Tragic 18.8% |
| Immigrants | Nicaragua | 0.7 /100 | #243 | Tragic 18.8% |
| Ecuadorians | 0.7 /100 | #244 | Tragic 18.8% |
| Shoshone | 0.6 /100 | #245 | Tragic 18.9% |
| Immigrants | Laos | 0.6 /100 | #246 | Tragic 18.9% |
| Immigrants | Ghana | 0.5 /100 | #247 | Tragic 18.9% |
| French American Indians | 0.3 /100 | #248 | Tragic 19.2% |
| Potawatomi | 0.3 /100 | #249 | Tragic 19.2% |
| Cape Verdeans | 0.3 /100 | #250 | Tragic 19.2% |
| Immigrants | Trinidad and Tobago | 0.3 /100 | #251 | Tragic 19.2% |