Ute vs Immigrants from Egypt Child Poverty Among Girls Under 16
COMPARE
Ute
Immigrants from Egypt
Child Poverty Among Girls Under 16
Child Poverty Among Girls Under 16 Comparison
Ute
Immigrants from Egypt
21.8%
CHILD POVERTY AMONG GIRLS UNDER 16
0.0/ 100
METRIC RATING
315th/ 347
METRIC RANK
15.0%
CHILD POVERTY AMONG GIRLS UNDER 16
95.7/ 100
METRIC RATING
99th/ 347
METRIC RANK
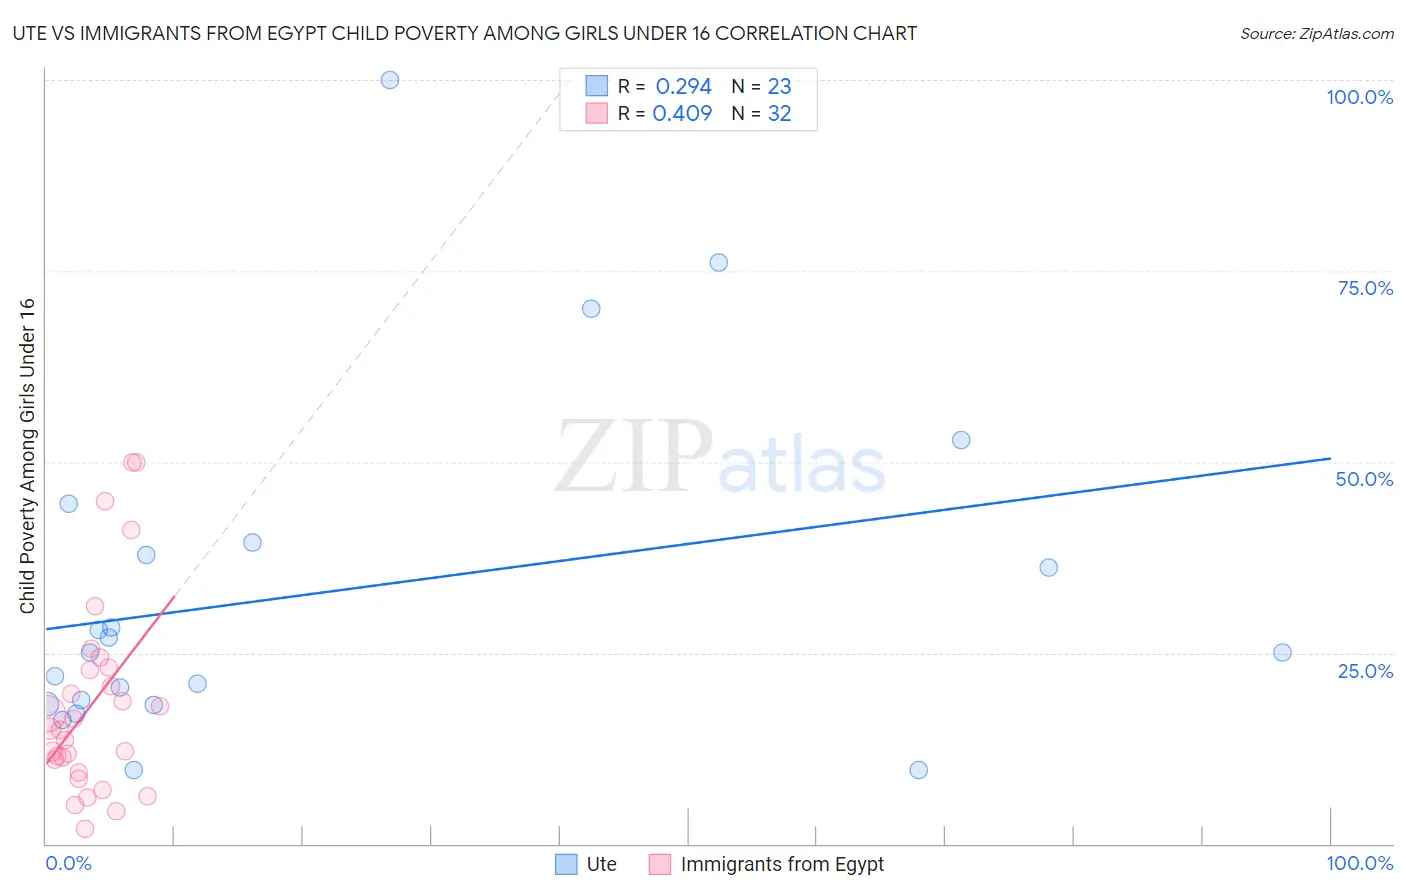
Ute vs Immigrants from Egypt Child Poverty Among Girls Under 16 Correlation Chart
The statistical analysis conducted on geographies consisting of 55,563,406 people shows a weak positive correlation between the proportion of Ute and poverty level among girls under the age of 16 in the United States with a correlation coefficient (R) of 0.294 and weighted average of 21.8%. Similarly, the statistical analysis conducted on geographies consisting of 242,560,639 people shows a moderate positive correlation between the proportion of Immigrants from Egypt and poverty level among girls under the age of 16 in the United States with a correlation coefficient (R) of 0.409 and weighted average of 15.0%, a difference of 45.3%.
Child Poverty Among Girls Under 16 Correlation Summary
| Measurement | Ute | Immigrants from Egypt |
| Minimum | 9.6% | 1.9% |
| Maximum | 100.0% | 50.0% |
| Range | 90.4% | 48.1% |
| Mean | 33.1% | 18.3% |
| Median | 25.0% | 15.0% |
| Interquartile 25% (IQ1) | 18.3% | 10.2% |
| Interquartile 75% (IQ3) | 39.5% | 22.9% |
| Interquartile Range (IQR) | 21.2% | 12.7% |
| Standard Deviation (Sample) | 22.6% | 12.8% |
| Standard Deviation (Population) | 22.1% | 12.6% |
Similar Demographics by Child Poverty Among Girls Under 16
Demographics Similar to Ute by Child Poverty Among Girls Under 16
In terms of child poverty among girls under 16, the demographic groups most similar to Ute are Immigrants from Guatemala (21.9%, a difference of 0.27%), Arapaho (21.7%, a difference of 0.28%), Creek (21.7%, a difference of 0.29%), African (21.9%, a difference of 0.59%), and Immigrants from Mexico (21.6%, a difference of 0.80%).
| Demographics | Rating | Rank | Child Poverty Among Girls Under 16 |
| Houma | 0.0 /100 | #308 | Tragic 21.5% |
| Bahamians | 0.0 /100 | #309 | Tragic 21.5% |
| Immigrants | Somalia | 0.0 /100 | #310 | Tragic 21.6% |
| Dutch West Indians | 0.0 /100 | #311 | Tragic 21.6% |
| Immigrants | Mexico | 0.0 /100 | #312 | Tragic 21.6% |
| Creek | 0.0 /100 | #313 | Tragic 21.7% |
| Arapaho | 0.0 /100 | #314 | Tragic 21.7% |
| Ute | 0.0 /100 | #315 | Tragic 21.8% |
| Immigrants | Guatemala | 0.0 /100 | #316 | Tragic 21.9% |
| Africans | 0.0 /100 | #317 | Tragic 21.9% |
| Immigrants | Dominica | 0.0 /100 | #318 | Tragic 22.1% |
| U.S. Virgin Islanders | 0.0 /100 | #319 | Tragic 22.1% |
| Hondurans | 0.0 /100 | #320 | Tragic 22.2% |
| Colville | 0.0 /100 | #321 | Tragic 22.5% |
| Yakama | 0.0 /100 | #322 | Tragic 22.6% |
Demographics Similar to Immigrants from Egypt by Child Poverty Among Girls Under 16
In terms of child poverty among girls under 16, the demographic groups most similar to Immigrants from Egypt are Paraguayan (15.0%, a difference of 0.040%), Immigrants from South Africa (15.0%, a difference of 0.070%), Immigrants from Malaysia (15.0%, a difference of 0.090%), British (15.0%, a difference of 0.11%), and Basque (15.0%, a difference of 0.15%).
| Demographics | Rating | Rank | Child Poverty Among Girls Under 16 |
| Austrians | 96.7 /100 | #92 | Exceptional 14.9% |
| Immigrants | North America | 96.6 /100 | #93 | Exceptional 14.9% |
| Immigrants | Switzerland | 96.3 /100 | #94 | Exceptional 14.9% |
| Germans | 96.3 /100 | #95 | Exceptional 14.9% |
| Immigrants | France | 96.2 /100 | #96 | Exceptional 14.9% |
| Immigrants | Latvia | 96.1 /100 | #97 | Exceptional 14.9% |
| Basques | 95.9 /100 | #98 | Exceptional 15.0% |
| Immigrants | Egypt | 95.7 /100 | #99 | Exceptional 15.0% |
| Paraguayans | 95.7 /100 | #100 | Exceptional 15.0% |
| Immigrants | South Africa | 95.6 /100 | #101 | Exceptional 15.0% |
| Immigrants | Malaysia | 95.6 /100 | #102 | Exceptional 15.0% |
| British | 95.6 /100 | #103 | Exceptional 15.0% |
| Romanians | 95.3 /100 | #104 | Exceptional 15.0% |
| Immigrants | England | 95.1 /100 | #105 | Exceptional 15.1% |
| Chileans | 95.1 /100 | #106 | Exceptional 15.1% |