Ukrainian vs Costa Rican Married-Couple Family Poverty
COMPARE
Ukrainian
Costa Rican
Married-Couple Family Poverty
Married-Couple Family Poverty Comparison
Ukrainians
Costa Ricans
4.5%
MARRIED-COUPLE FAMILY POVERTY
99.2/ 100
METRIC RATING
73rd/ 347
METRIC RANK
5.1%
MARRIED-COUPLE FAMILY POVERTY
61.5/ 100
METRIC RATING
167th/ 347
METRIC RANK
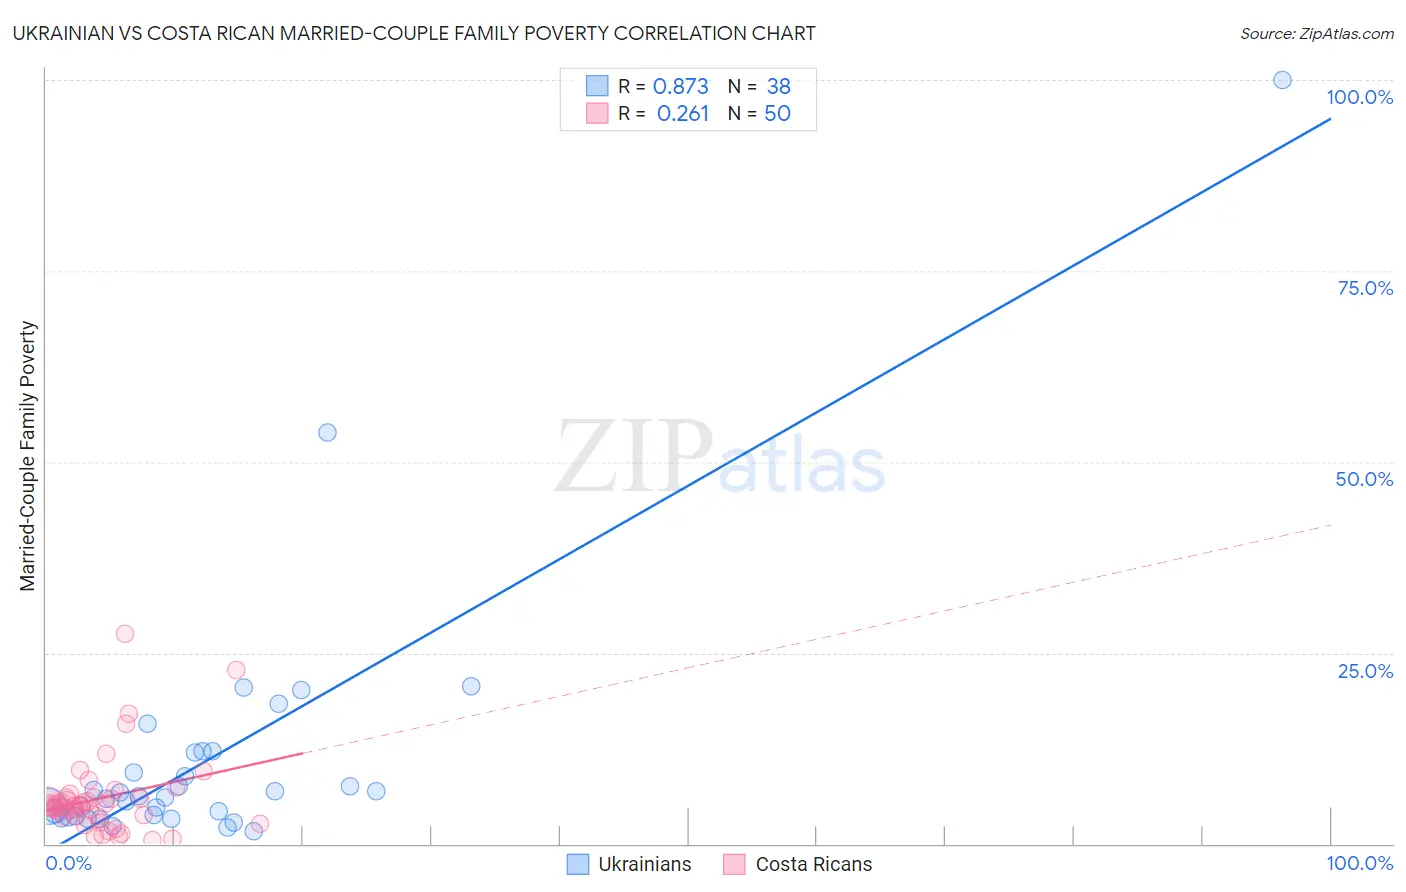
Ukrainian vs Costa Rican Married-Couple Family Poverty Correlation Chart
The statistical analysis conducted on geographies consisting of 441,666,258 people shows a very strong positive correlation between the proportion of Ukrainians and poverty level among married-couple families in the United States with a correlation coefficient (R) of 0.873 and weighted average of 4.5%. Similarly, the statistical analysis conducted on geographies consisting of 252,586,429 people shows a weak positive correlation between the proportion of Costa Ricans and poverty level among married-couple families in the United States with a correlation coefficient (R) of 0.261 and weighted average of 5.1%, a difference of 14.9%.
Married-Couple Family Poverty Correlation Summary
| Measurement | Ukrainian | Costa Rican |
| Minimum | 1.6% | 0.54% |
| Maximum | 100.0% | 27.6% |
| Range | 98.4% | 27.0% |
| Mean | 11.2% | 6.0% |
| Median | 6.1% | 5.0% |
| Interquartile 25% (IQ1) | 3.7% | 3.5% |
| Interquartile 75% (IQ3) | 12.0% | 6.0% |
| Interquartile Range (IQR) | 8.3% | 2.5% |
| Standard Deviation (Sample) | 17.4% | 5.2% |
| Standard Deviation (Population) | 17.2% | 5.1% |
Similar Demographics by Married-Couple Family Poverty
Demographics Similar to Ukrainians by Married-Couple Family Poverty
In terms of married-couple family poverty, the demographic groups most similar to Ukrainians are Immigrants from Austria (4.5%, a difference of 0.10%), Immigrants from England (4.5%, a difference of 0.12%), Immigrants from North America (4.5%, a difference of 0.22%), Cambodian (4.5%, a difference of 0.37%), and Immigrants from South Africa (4.5%, a difference of 0.48%).
| Demographics | Rating | Rank | Married-Couple Family Poverty |
| Immigrants | Serbia | 99.4 /100 | #66 | Exceptional 4.4% |
| Immigrants | Canada | 99.4 /100 | #67 | Exceptional 4.4% |
| Slavs | 99.4 /100 | #68 | Exceptional 4.4% |
| New Zealanders | 99.4 /100 | #69 | Exceptional 4.4% |
| Immigrants | Korea | 99.4 /100 | #70 | Exceptional 4.5% |
| Immigrants | North America | 99.3 /100 | #71 | Exceptional 4.5% |
| Immigrants | England | 99.3 /100 | #72 | Exceptional 4.5% |
| Ukrainians | 99.2 /100 | #73 | Exceptional 4.5% |
| Immigrants | Austria | 99.2 /100 | #74 | Exceptional 4.5% |
| Cambodians | 99.2 /100 | #75 | Exceptional 4.5% |
| Immigrants | South Africa | 99.1 /100 | #76 | Exceptional 4.5% |
| Immigrants | Latvia | 99.1 /100 | #77 | Exceptional 4.5% |
| Scotch-Irish | 99.1 /100 | #78 | Exceptional 4.5% |
| Immigrants | Iran | 99.0 /100 | #79 | Exceptional 4.5% |
| Icelanders | 99.0 /100 | #80 | Exceptional 4.5% |
Demographics Similar to Costa Ricans by Married-Couple Family Poverty
In terms of married-couple family poverty, the demographic groups most similar to Costa Ricans are Paraguayan (5.1%, a difference of 0.0%), Immigrants from Malaysia (5.1%, a difference of 0.090%), Hawaiian (5.1%, a difference of 0.10%), Sierra Leonean (5.1%, a difference of 0.34%), and Immigrants from Jordan (5.1%, a difference of 0.65%).
| Demographics | Rating | Rank | Married-Couple Family Poverty |
| Pennsylvania Germans | 68.5 /100 | #160 | Good 5.1% |
| Ethiopians | 68.1 /100 | #161 | Good 5.1% |
| Immigrants | Jordan | 66.5 /100 | #162 | Good 5.1% |
| Sierra Leoneans | 64.1 /100 | #163 | Good 5.1% |
| Hawaiians | 62.3 /100 | #164 | Good 5.1% |
| Immigrants | Malaysia | 62.2 /100 | #165 | Good 5.1% |
| Paraguayans | 61.5 /100 | #166 | Good 5.1% |
| Costa Ricans | 61.5 /100 | #167 | Good 5.1% |
| Immigrants | Uganda | 54.9 /100 | #168 | Average 5.2% |
| Ottawa | 54.5 /100 | #169 | Average 5.2% |
| Immigrants | Argentina | 54.4 /100 | #170 | Average 5.2% |
| Bermudans | 52.9 /100 | #171 | Average 5.2% |
| Immigrants | Northern Africa | 51.3 /100 | #172 | Average 5.2% |
| Alsatians | 51.2 /100 | #173 | Average 5.2% |
| Immigrants | Eastern Africa | 50.0 /100 | #174 | Average 5.2% |