Cajun vs Costa Rican Married-Couple Family Poverty
COMPARE
Cajun
Costa Rican
Married-Couple Family Poverty
Married-Couple Family Poverty Comparison
Cajuns
Costa Ricans
5.6%
MARRIED-COUPLE FAMILY POVERTY
6.9/ 100
METRIC RATING
222nd/ 347
METRIC RANK
5.1%
MARRIED-COUPLE FAMILY POVERTY
61.5/ 100
METRIC RATING
167th/ 347
METRIC RANK
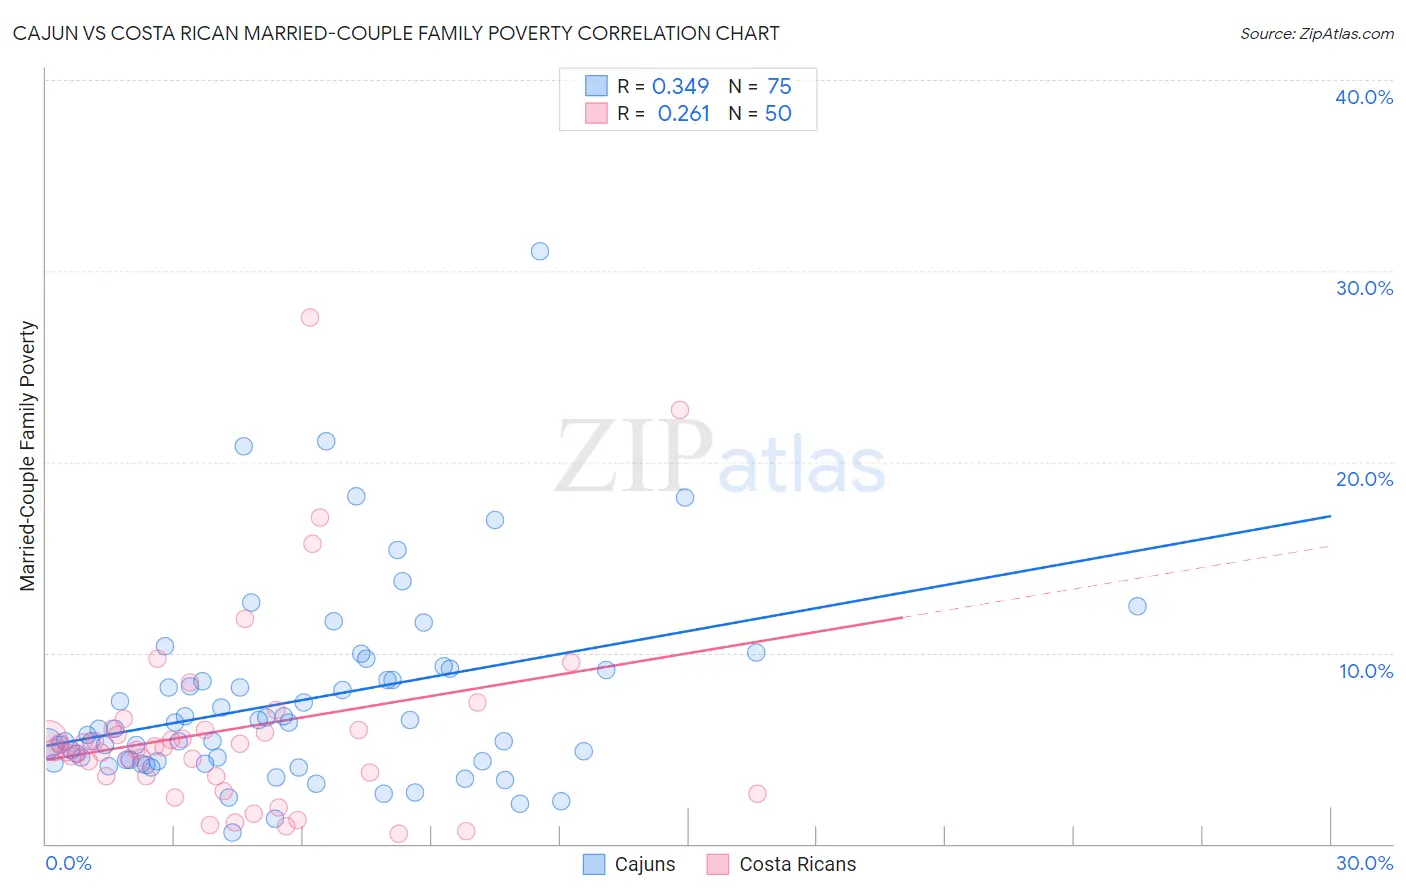
Cajun vs Costa Rican Married-Couple Family Poverty Correlation Chart
The statistical analysis conducted on geographies consisting of 149,203,084 people shows a mild positive correlation between the proportion of Cajuns and poverty level among married-couple families in the United States with a correlation coefficient (R) of 0.349 and weighted average of 5.6%. Similarly, the statistical analysis conducted on geographies consisting of 252,586,429 people shows a weak positive correlation between the proportion of Costa Ricans and poverty level among married-couple families in the United States with a correlation coefficient (R) of 0.261 and weighted average of 5.1%, a difference of 9.1%.
Married-Couple Family Poverty Correlation Summary
| Measurement | Cajun | Costa Rican |
| Minimum | 0.57% | 0.54% |
| Maximum | 31.0% | 27.6% |
| Range | 30.5% | 27.0% |
| Mean | 7.5% | 6.0% |
| Median | 6.0% | 5.0% |
| Interquartile 25% (IQ1) | 4.3% | 3.5% |
| Interquartile 75% (IQ3) | 9.1% | 6.0% |
| Interquartile Range (IQR) | 4.8% | 2.5% |
| Standard Deviation (Sample) | 5.1% | 5.2% |
| Standard Deviation (Population) | 5.1% | 5.1% |
Similar Demographics by Married-Couple Family Poverty
Demographics Similar to Cajuns by Married-Couple Family Poverty
In terms of married-couple family poverty, the demographic groups most similar to Cajuns are Immigrants from Fiji (5.6%, a difference of 0.070%), Sudanese (5.6%, a difference of 0.18%), Immigrants from Cambodia (5.6%, a difference of 0.32%), South American (5.6%, a difference of 0.55%), and Immigrants from Zaire (5.6%, a difference of 0.56%).
| Demographics | Rating | Rank | Married-Couple Family Poverty |
| Armenians | 12.8 /100 | #215 | Poor 5.5% |
| Potawatomi | 12.4 /100 | #216 | Poor 5.5% |
| Immigrants | Nigeria | 11.3 /100 | #217 | Poor 5.5% |
| Afghans | 11.2 /100 | #218 | Poor 5.5% |
| Japanese | 9.8 /100 | #219 | Tragic 5.6% |
| Colombians | 9.2 /100 | #220 | Tragic 5.6% |
| Panamanians | 9.2 /100 | #221 | Tragic 5.6% |
| Cajuns | 6.9 /100 | #222 | Tragic 5.6% |
| Immigrants | Fiji | 6.7 /100 | #223 | Tragic 5.6% |
| Sudanese | 6.4 /100 | #224 | Tragic 5.6% |
| Immigrants | Cambodia | 6.1 /100 | #225 | Tragic 5.6% |
| South Americans | 5.7 /100 | #226 | Tragic 5.6% |
| Immigrants | Zaire | 5.6 /100 | #227 | Tragic 5.6% |
| Arabs | 5.4 /100 | #228 | Tragic 5.7% |
| Sub-Saharan Africans | 4.9 /100 | #229 | Tragic 5.7% |
Demographics Similar to Costa Ricans by Married-Couple Family Poverty
In terms of married-couple family poverty, the demographic groups most similar to Costa Ricans are Paraguayan (5.1%, a difference of 0.0%), Immigrants from Malaysia (5.1%, a difference of 0.090%), Hawaiian (5.1%, a difference of 0.10%), Sierra Leonean (5.1%, a difference of 0.34%), and Immigrants from Jordan (5.1%, a difference of 0.65%).
| Demographics | Rating | Rank | Married-Couple Family Poverty |
| Pennsylvania Germans | 68.5 /100 | #160 | Good 5.1% |
| Ethiopians | 68.1 /100 | #161 | Good 5.1% |
| Immigrants | Jordan | 66.5 /100 | #162 | Good 5.1% |
| Sierra Leoneans | 64.1 /100 | #163 | Good 5.1% |
| Hawaiians | 62.3 /100 | #164 | Good 5.1% |
| Immigrants | Malaysia | 62.2 /100 | #165 | Good 5.1% |
| Paraguayans | 61.5 /100 | #166 | Good 5.1% |
| Costa Ricans | 61.5 /100 | #167 | Good 5.1% |
| Immigrants | Uganda | 54.9 /100 | #168 | Average 5.2% |
| Ottawa | 54.5 /100 | #169 | Average 5.2% |
| Immigrants | Argentina | 54.4 /100 | #170 | Average 5.2% |
| Bermudans | 52.9 /100 | #171 | Average 5.2% |
| Immigrants | Northern Africa | 51.3 /100 | #172 | Average 5.2% |
| Alsatians | 51.2 /100 | #173 | Average 5.2% |
| Immigrants | Eastern Africa | 50.0 /100 | #174 | Average 5.2% |