Ugandan vs Soviet Union Average Family Size
COMPARE
Ugandan
Soviet Union
Average Family Size
Average Family Size Comparison
Ugandans
Soviet Union
3.23
AVERAGE FAMILY SIZE
58.4/ 100
METRIC RATING
165th/ 347
METRIC RANK
3.11
AVERAGE FAMILY SIZE
0.0/ 100
METRIC RATING
323rd/ 347
METRIC RANK
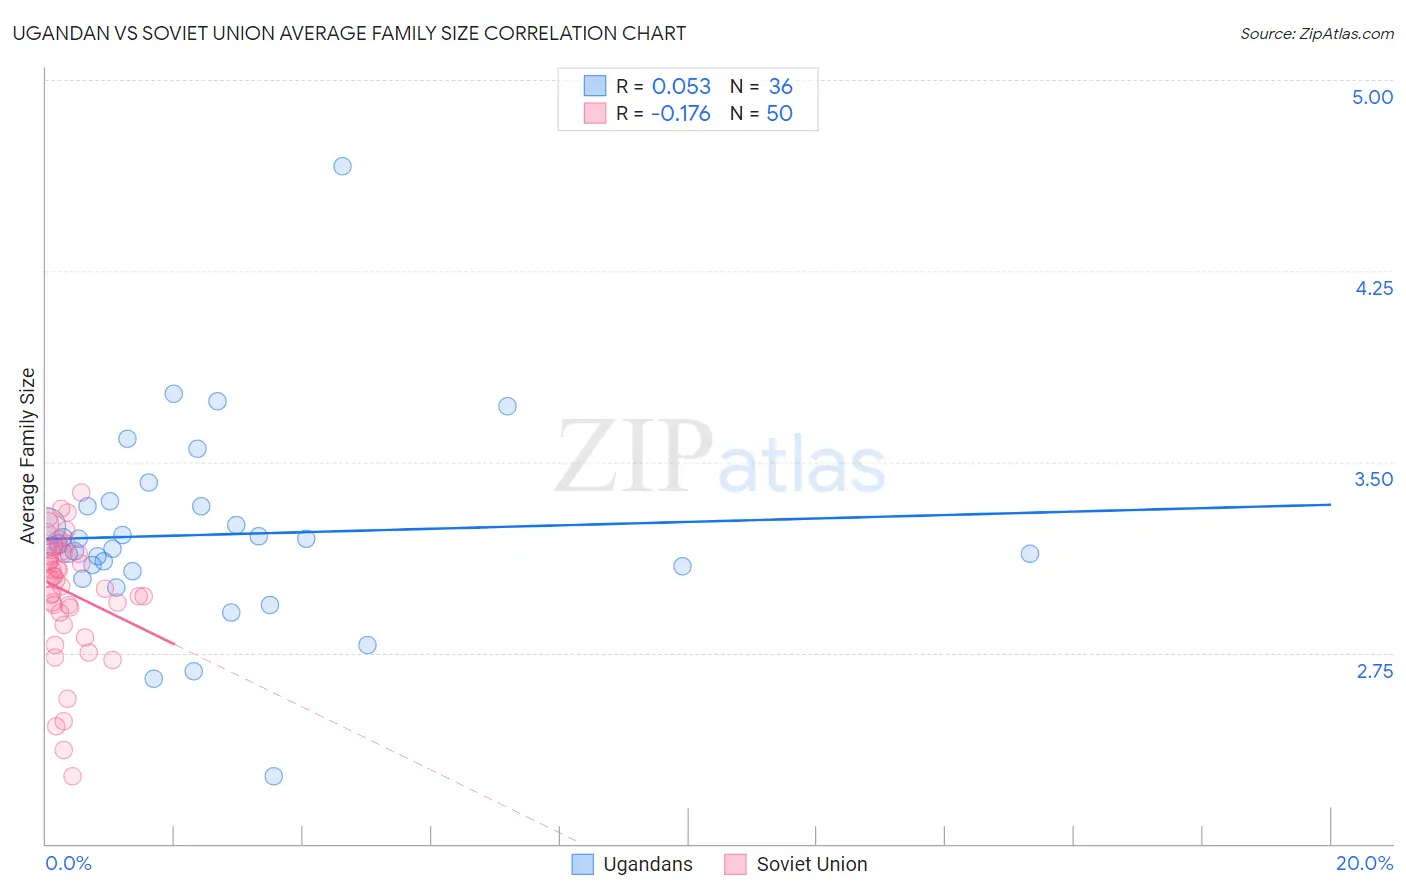
Ugandan vs Soviet Union Average Family Size Correlation Chart
The statistical analysis conducted on geographies consisting of 93,998,632 people shows a slight positive correlation between the proportion of Ugandans and average family size in the United States with a correlation coefficient (R) of 0.053 and weighted average of 3.23. Similarly, the statistical analysis conducted on geographies consisting of 43,509,630 people shows a poor negative correlation between the proportion of Soviet Union and average family size in the United States with a correlation coefficient (R) of -0.176 and weighted average of 3.11, a difference of 3.8%.
Average Family Size Correlation Summary
| Measurement | Ugandan | Soviet Union |
| Minimum | 2.26 | 2.27 |
| Maximum | 4.66 | 3.38 |
| Range | 2.40 | 1.11 |
| Mean | 3.21 | 2.99 |
| Median | 3.17 | 3.05 |
| Interquartile 25% (IQ1) | 3.08 | 2.93 |
| Interquartile 75% (IQ3) | 3.33 | 3.15 |
| Interquartile Range (IQR) | 0.25 | 0.22 |
| Standard Deviation (Sample) | 0.39 | 0.24 |
| Standard Deviation (Population) | 0.38 | 0.24 |
Similar Demographics by Average Family Size
Demographics Similar to Ugandans by Average Family Size
In terms of average family size, the demographic groups most similar to Ugandans are Egyptian (3.23, a difference of 0.0%), Uruguayan (3.23, a difference of 0.010%), Immigrants from Senegal (3.23, a difference of 0.020%), Immigrants from Uganda (3.23, a difference of 0.030%), and Dutch West Indian (3.23, a difference of 0.030%).
| Demographics | Rating | Rank | Average Family Size |
| Iraqis | 64.3 /100 | #158 | Good 3.24 |
| Ethiopians | 63.9 /100 | #159 | Good 3.24 |
| Immigrants | Iraq | 63.7 /100 | #160 | Good 3.24 |
| Immigrants | Chile | 63.2 /100 | #161 | Good 3.24 |
| Immigrants | Uganda | 60.1 /100 | #162 | Good 3.23 |
| Uruguayans | 58.8 /100 | #163 | Average 3.23 |
| Egyptians | 58.6 /100 | #164 | Average 3.23 |
| Ugandans | 58.4 /100 | #165 | Average 3.23 |
| Immigrants | Senegal | 57.5 /100 | #166 | Average 3.23 |
| Dutch West Indians | 56.9 /100 | #167 | Average 3.23 |
| Taiwanese | 54.2 /100 | #168 | Average 3.23 |
| Aleuts | 54.1 /100 | #169 | Average 3.23 |
| Arabs | 53.8 /100 | #170 | Average 3.23 |
| Chileans | 53.2 /100 | #171 | Average 3.23 |
| Immigrants | Congo | 52.7 /100 | #172 | Average 3.23 |
Demographics Similar to Soviet Union by Average Family Size
In terms of average family size, the demographic groups most similar to Soviet Union are Immigrants from Austria (3.12, a difference of 0.030%), Immigrants from Canada (3.12, a difference of 0.030%), Immigrants from North America (3.12, a difference of 0.060%), Celtic (3.11, a difference of 0.080%), and English (3.11, a difference of 0.12%).
| Demographics | Rating | Rank | Average Family Size |
| Serbians | 0.1 /100 | #316 | Tragic 3.12 |
| Italians | 0.1 /100 | #317 | Tragic 3.12 |
| Eastern Europeans | 0.1 /100 | #318 | Tragic 3.12 |
| Welsh | 0.1 /100 | #319 | Tragic 3.12 |
| Immigrants | North America | 0.0 /100 | #320 | Tragic 3.12 |
| Immigrants | Austria | 0.0 /100 | #321 | Tragic 3.12 |
| Immigrants | Canada | 0.0 /100 | #322 | Tragic 3.12 |
| Soviet Union | 0.0 /100 | #323 | Tragic 3.11 |
| Celtics | 0.0 /100 | #324 | Tragic 3.11 |
| English | 0.0 /100 | #325 | Tragic 3.11 |
| Ottawa | 0.0 /100 | #326 | Tragic 3.11 |
| Dutch | 0.0 /100 | #327 | Tragic 3.11 |
| Czechs | 0.0 /100 | #328 | Tragic 3.11 |
| Belgians | 0.0 /100 | #329 | Tragic 3.11 |
| Latvians | 0.0 /100 | #330 | Tragic 3.11 |