Ugandan vs Tlingit-Haida Single Female Poverty
COMPARE
Ugandan
Tlingit-Haida
Single Female Poverty
Single Female Poverty Comparison
Ugandans
Tlingit-Haida
20.8%
SINGLE FEMALE POVERTY
64.0/ 100
METRIC RATING
165th/ 347
METRIC RANK
21.9%
SINGLE FEMALE POVERTY
5.4/ 100
METRIC RATING
229th/ 347
METRIC RANK
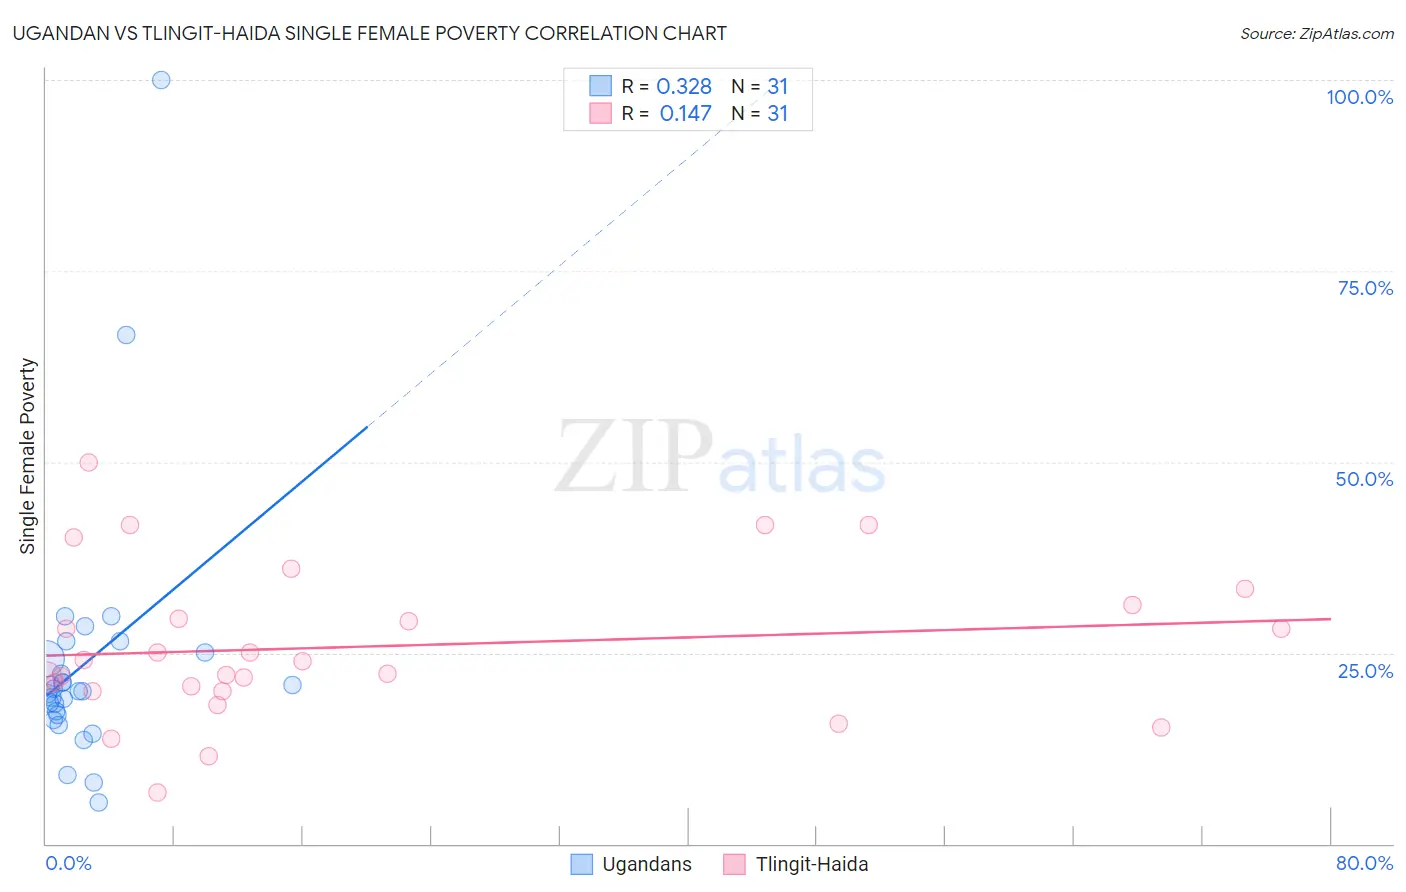
Ugandan vs Tlingit-Haida Single Female Poverty Correlation Chart
The statistical analysis conducted on geographies consisting of 93,803,349 people shows a mild positive correlation between the proportion of Ugandans and poverty level among single females in the United States with a correlation coefficient (R) of 0.328 and weighted average of 20.8%. Similarly, the statistical analysis conducted on geographies consisting of 60,536,912 people shows a poor positive correlation between the proportion of Tlingit-Haida and poverty level among single females in the United States with a correlation coefficient (R) of 0.147 and weighted average of 21.9%, a difference of 5.4%.
Single Female Poverty Correlation Summary
| Measurement | Ugandan | Tlingit-Haida |
| Minimum | 5.5% | 6.7% |
| Maximum | 100.0% | 50.0% |
| Range | 94.5% | 43.3% |
| Mean | 23.7% | 25.9% |
| Median | 20.0% | 23.9% |
| Interquartile 25% (IQ1) | 16.9% | 20.0% |
| Interquartile 75% (IQ3) | 25.0% | 31.2% |
| Interquartile Range (IQR) | 8.1% | 11.2% |
| Standard Deviation (Sample) | 17.5% | 9.9% |
| Standard Deviation (Population) | 17.2% | 9.8% |
Similar Demographics by Single Female Poverty
Demographics Similar to Ugandans by Single Female Poverty
In terms of single female poverty, the demographic groups most similar to Ugandans are Iraqi (20.8%, a difference of 0.040%), Norwegian (20.8%, a difference of 0.060%), Immigrants from Norway (20.8%, a difference of 0.070%), Immigrants from Costa Rica (20.9%, a difference of 0.16%), and Lebanese (20.8%, a difference of 0.26%).
| Demographics | Rating | Rank | Single Female Poverty |
| Danes | 73.0 /100 | #158 | Good 20.7% |
| Costa Ricans | 71.8 /100 | #159 | Good 20.7% |
| Arabs | 70.8 /100 | #160 | Good 20.7% |
| Kenyans | 68.5 /100 | #161 | Good 20.8% |
| Northern Europeans | 68.4 /100 | #162 | Good 20.8% |
| Lebanese | 67.6 /100 | #163 | Good 20.8% |
| Iraqis | 64.5 /100 | #164 | Good 20.8% |
| Ugandans | 64.0 /100 | #165 | Good 20.8% |
| Norwegians | 63.0 /100 | #166 | Good 20.8% |
| Immigrants | Norway | 63.0 /100 | #167 | Good 20.8% |
| Immigrants | Costa Rica | 61.5 /100 | #168 | Good 20.9% |
| Immigrants | Trinidad and Tobago | 56.3 /100 | #169 | Average 20.9% |
| New Zealanders | 53.2 /100 | #170 | Average 21.0% |
| Moroccans | 52.8 /100 | #171 | Average 21.0% |
| Guyanese | 52.0 /100 | #172 | Average 21.0% |
Demographics Similar to Tlingit-Haida by Single Female Poverty
In terms of single female poverty, the demographic groups most similar to Tlingit-Haida are Immigrants from Western Africa (22.0%, a difference of 0.020%), Salvadoran (21.9%, a difference of 0.030%), Welsh (22.0%, a difference of 0.11%), Immigrants from Ghana (21.9%, a difference of 0.12%), and Immigrants from Thailand (22.0%, a difference of 0.12%).
| Demographics | Rating | Rank | Single Female Poverty |
| Immigrants | Eritrea | 7.9 /100 | #222 | Tragic 21.8% |
| Scottish | 7.3 /100 | #223 | Tragic 21.8% |
| Barbadians | 7.2 /100 | #224 | Tragic 21.8% |
| English | 6.4 /100 | #225 | Tragic 21.9% |
| Immigrants | Portugal | 5.8 /100 | #226 | Tragic 21.9% |
| Immigrants | Ghana | 5.8 /100 | #227 | Tragic 21.9% |
| Salvadorans | 5.5 /100 | #228 | Tragic 21.9% |
| Tlingit-Haida | 5.4 /100 | #229 | Tragic 21.9% |
| Immigrants | Western Africa | 5.3 /100 | #230 | Tragic 22.0% |
| Welsh | 5.0 /100 | #231 | Tragic 22.0% |
| Immigrants | Thailand | 5.0 /100 | #232 | Tragic 22.0% |
| Spaniards | 4.7 /100 | #233 | Tragic 22.0% |
| Spanish | 4.7 /100 | #234 | Tragic 22.0% |
| Dutch | 4.6 /100 | #235 | Tragic 22.0% |
| Immigrants | Ecuador | 4.2 /100 | #236 | Tragic 22.0% |