Ugandan vs Immigrants from Dominica Single Female Poverty
COMPARE
Ugandan
Immigrants from Dominica
Single Female Poverty
Single Female Poverty Comparison
Ugandans
Immigrants from Dominica
20.8%
SINGLE FEMALE POVERTY
64.0/ 100
METRIC RATING
165th/ 347
METRIC RANK
23.9%
SINGLE FEMALE POVERTY
0.0/ 100
METRIC RATING
284th/ 347
METRIC RANK
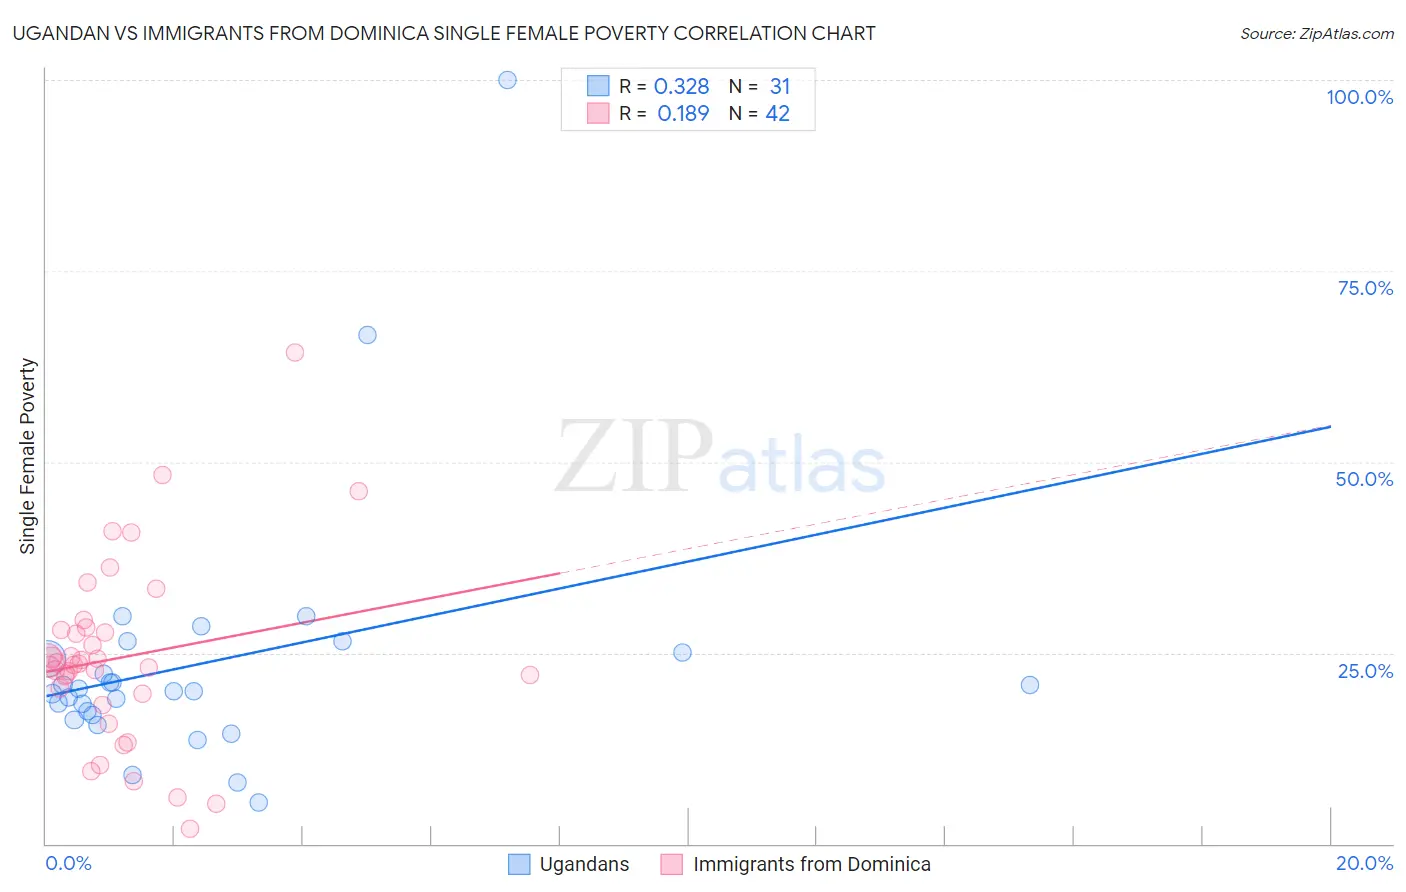
Ugandan vs Immigrants from Dominica Single Female Poverty Correlation Chart
The statistical analysis conducted on geographies consisting of 93,803,349 people shows a mild positive correlation between the proportion of Ugandans and poverty level among single females in the United States with a correlation coefficient (R) of 0.328 and weighted average of 20.8%. Similarly, the statistical analysis conducted on geographies consisting of 83,649,694 people shows a poor positive correlation between the proportion of Immigrants from Dominica and poverty level among single females in the United States with a correlation coefficient (R) of 0.189 and weighted average of 23.9%, a difference of 14.8%.
Single Female Poverty Correlation Summary
| Measurement | Ugandan | Immigrants from Dominica |
| Minimum | 5.5% | 2.0% |
| Maximum | 100.0% | 64.4% |
| Range | 94.5% | 62.4% |
| Mean | 23.7% | 24.4% |
| Median | 20.0% | 23.5% |
| Interquartile 25% (IQ1) | 16.9% | 19.7% |
| Interquartile 75% (IQ3) | 25.0% | 28.1% |
| Interquartile Range (IQR) | 8.1% | 8.4% |
| Standard Deviation (Sample) | 17.5% | 12.0% |
| Standard Deviation (Population) | 17.2% | 11.9% |
Similar Demographics by Single Female Poverty
Demographics Similar to Ugandans by Single Female Poverty
In terms of single female poverty, the demographic groups most similar to Ugandans are Iraqi (20.8%, a difference of 0.040%), Norwegian (20.8%, a difference of 0.060%), Immigrants from Norway (20.8%, a difference of 0.070%), Immigrants from Costa Rica (20.9%, a difference of 0.16%), and Lebanese (20.8%, a difference of 0.26%).
| Demographics | Rating | Rank | Single Female Poverty |
| Danes | 73.0 /100 | #158 | Good 20.7% |
| Costa Ricans | 71.8 /100 | #159 | Good 20.7% |
| Arabs | 70.8 /100 | #160 | Good 20.7% |
| Kenyans | 68.5 /100 | #161 | Good 20.8% |
| Northern Europeans | 68.4 /100 | #162 | Good 20.8% |
| Lebanese | 67.6 /100 | #163 | Good 20.8% |
| Iraqis | 64.5 /100 | #164 | Good 20.8% |
| Ugandans | 64.0 /100 | #165 | Good 20.8% |
| Norwegians | 63.0 /100 | #166 | Good 20.8% |
| Immigrants | Norway | 63.0 /100 | #167 | Good 20.8% |
| Immigrants | Costa Rica | 61.5 /100 | #168 | Good 20.9% |
| Immigrants | Trinidad and Tobago | 56.3 /100 | #169 | Average 20.9% |
| New Zealanders | 53.2 /100 | #170 | Average 21.0% |
| Moroccans | 52.8 /100 | #171 | Average 21.0% |
| Guyanese | 52.0 /100 | #172 | Average 21.0% |
Demographics Similar to Immigrants from Dominica by Single Female Poverty
In terms of single female poverty, the demographic groups most similar to Immigrants from Dominica are German Russian (23.9%, a difference of 0.11%), Guatemalan (23.8%, a difference of 0.25%), Immigrants from Zaire (23.8%, a difference of 0.31%), Immigrants from Latin America (23.7%, a difference of 0.82%), and Immigrants from Guatemala (24.1%, a difference of 0.86%).
| Demographics | Rating | Rank | Single Female Poverty |
| Pennsylvania Germans | 0.0 /100 | #277 | Tragic 23.6% |
| Immigrants | Nonimmigrants | 0.0 /100 | #278 | Tragic 23.6% |
| Alaskan Athabascans | 0.0 /100 | #279 | Tragic 23.6% |
| Immigrants | Latin America | 0.0 /100 | #280 | Tragic 23.7% |
| Immigrants | Zaire | 0.0 /100 | #281 | Tragic 23.8% |
| Guatemalans | 0.0 /100 | #282 | Tragic 23.8% |
| German Russians | 0.0 /100 | #283 | Tragic 23.9% |
| Immigrants | Dominica | 0.0 /100 | #284 | Tragic 23.9% |
| Immigrants | Guatemala | 0.0 /100 | #285 | Tragic 24.1% |
| Cree | 0.0 /100 | #286 | Tragic 24.1% |
| Bangladeshis | 0.0 /100 | #287 | Tragic 24.2% |
| Spanish Americans | 0.0 /100 | #288 | Tragic 24.2% |
| U.S. Virgin Islanders | 0.0 /100 | #289 | Tragic 24.2% |
| Indonesians | 0.0 /100 | #290 | Tragic 24.3% |
| Osage | 0.0 /100 | #291 | Tragic 24.4% |