Ugandan vs Immigrants from Nepal Single Female Poverty
COMPARE
Ugandan
Immigrants from Nepal
Single Female Poverty
Single Female Poverty Comparison
Ugandans
Immigrants from Nepal
20.8%
SINGLE FEMALE POVERTY
64.0/ 100
METRIC RATING
165th/ 347
METRIC RANK
20.3%
SINGLE FEMALE POVERTY
90.6/ 100
METRIC RATING
137th/ 347
METRIC RANK
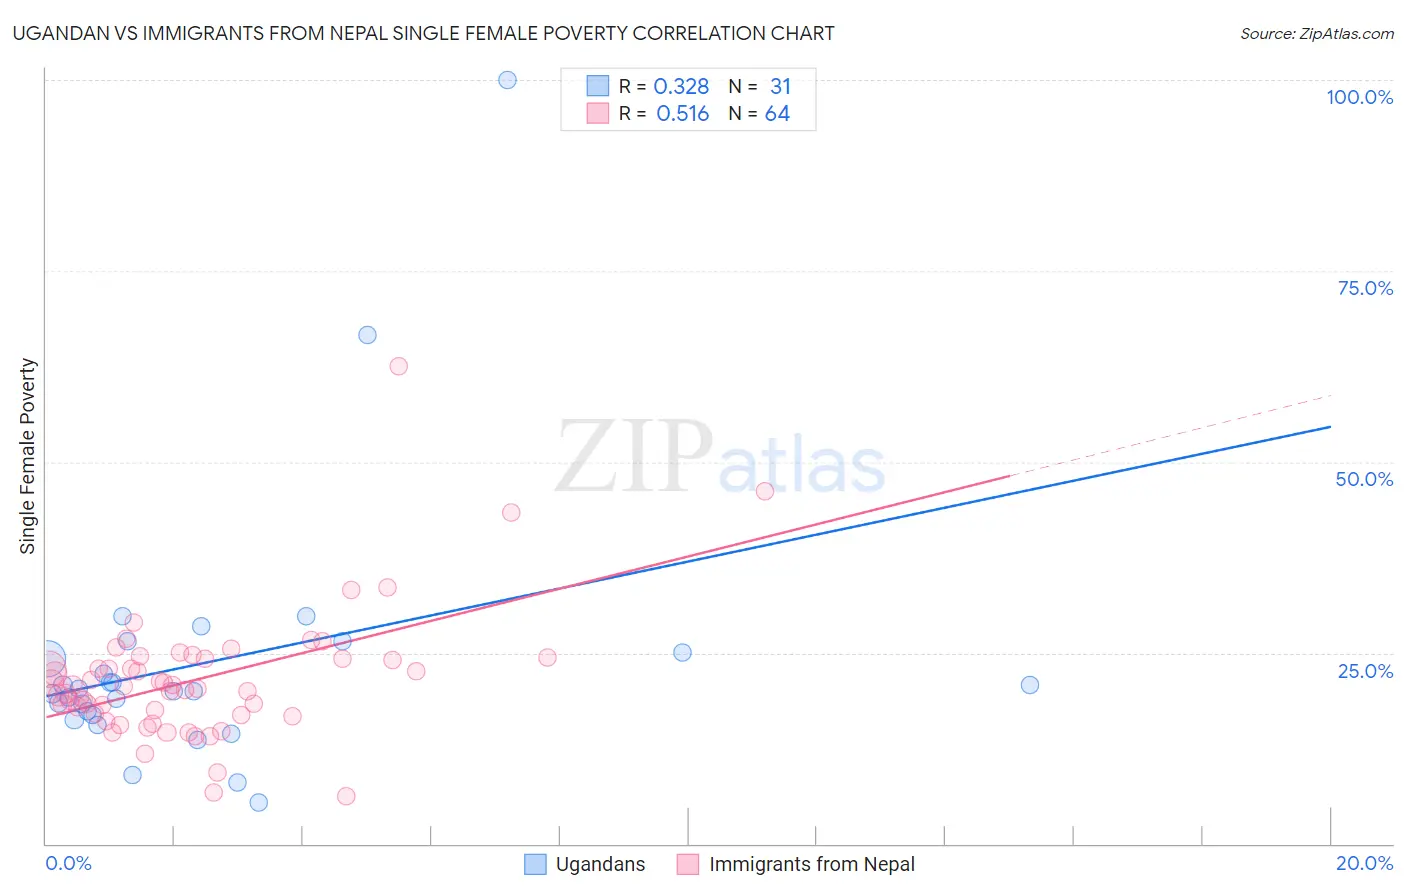
Ugandan vs Immigrants from Nepal Single Female Poverty Correlation Chart
The statistical analysis conducted on geographies consisting of 93,803,349 people shows a mild positive correlation between the proportion of Ugandans and poverty level among single females in the United States with a correlation coefficient (R) of 0.328 and weighted average of 20.8%. Similarly, the statistical analysis conducted on geographies consisting of 185,480,601 people shows a substantial positive correlation between the proportion of Immigrants from Nepal and poverty level among single females in the United States with a correlation coefficient (R) of 0.516 and weighted average of 20.3%, a difference of 2.7%.
Single Female Poverty Correlation Summary
| Measurement | Ugandan | Immigrants from Nepal |
| Minimum | 5.5% | 6.3% |
| Maximum | 100.0% | 62.5% |
| Range | 94.5% | 56.2% |
| Mean | 23.7% | 21.5% |
| Median | 20.0% | 20.5% |
| Interquartile 25% (IQ1) | 16.9% | 17.0% |
| Interquartile 75% (IQ3) | 25.0% | 24.3% |
| Interquartile Range (IQR) | 8.1% | 7.3% |
| Standard Deviation (Sample) | 17.5% | 8.5% |
| Standard Deviation (Population) | 17.2% | 8.5% |
Similar Demographics by Single Female Poverty
Demographics Similar to Ugandans by Single Female Poverty
In terms of single female poverty, the demographic groups most similar to Ugandans are Iraqi (20.8%, a difference of 0.040%), Norwegian (20.8%, a difference of 0.060%), Immigrants from Norway (20.8%, a difference of 0.070%), Immigrants from Costa Rica (20.9%, a difference of 0.16%), and Lebanese (20.8%, a difference of 0.26%).
| Demographics | Rating | Rank | Single Female Poverty |
| Danes | 73.0 /100 | #158 | Good 20.7% |
| Costa Ricans | 71.8 /100 | #159 | Good 20.7% |
| Arabs | 70.8 /100 | #160 | Good 20.7% |
| Kenyans | 68.5 /100 | #161 | Good 20.8% |
| Northern Europeans | 68.4 /100 | #162 | Good 20.8% |
| Lebanese | 67.6 /100 | #163 | Good 20.8% |
| Iraqis | 64.5 /100 | #164 | Good 20.8% |
| Ugandans | 64.0 /100 | #165 | Good 20.8% |
| Norwegians | 63.0 /100 | #166 | Good 20.8% |
| Immigrants | Norway | 63.0 /100 | #167 | Good 20.8% |
| Immigrants | Costa Rica | 61.5 /100 | #168 | Good 20.9% |
| Immigrants | Trinidad and Tobago | 56.3 /100 | #169 | Average 20.9% |
| New Zealanders | 53.2 /100 | #170 | Average 21.0% |
| Moroccans | 52.8 /100 | #171 | Average 21.0% |
| Guyanese | 52.0 /100 | #172 | Average 21.0% |
Demographics Similar to Immigrants from Nepal by Single Female Poverty
In terms of single female poverty, the demographic groups most similar to Immigrants from Nepal are Slovene (20.3%, a difference of 0.030%), Immigrants from Kuwait (20.3%, a difference of 0.040%), Syrian (20.3%, a difference of 0.050%), Immigrants from Canada (20.2%, a difference of 0.11%), and Immigrants from Iraq (20.2%, a difference of 0.12%).
| Demographics | Rating | Rank | Single Female Poverty |
| Immigrants | Hungary | 92.3 /100 | #130 | Exceptional 20.2% |
| Pakistanis | 92.1 /100 | #131 | Exceptional 20.2% |
| Uruguayans | 92.1 /100 | #132 | Exceptional 20.2% |
| Immigrants | England | 91.9 /100 | #133 | Exceptional 20.2% |
| Immigrants | Venezuela | 91.5 /100 | #134 | Exceptional 20.2% |
| Immigrants | Iraq | 91.2 /100 | #135 | Exceptional 20.2% |
| Immigrants | Canada | 91.2 /100 | #136 | Exceptional 20.2% |
| Immigrants | Nepal | 90.6 /100 | #137 | Exceptional 20.3% |
| Slovenes | 90.5 /100 | #138 | Exceptional 20.3% |
| Immigrants | Kuwait | 90.4 /100 | #139 | Exceptional 20.3% |
| Syrians | 90.4 /100 | #140 | Exceptional 20.3% |
| Immigrants | North America | 89.5 /100 | #141 | Excellent 20.3% |
| Immigrants | Uganda | 89.1 /100 | #142 | Excellent 20.3% |
| Australians | 88.4 /100 | #143 | Excellent 20.3% |
| Immigrants | Uzbekistan | 88.3 /100 | #144 | Excellent 20.3% |