Ugandan vs Soviet Union Master's Degree
COMPARE
Ugandan
Soviet Union
Master's Degree
Master's Degree Comparison
Ugandans
Soviet Union
17.1%
MASTER'S DEGREE
99.0/ 100
METRIC RATING
94th/ 347
METRIC RANK
20.5%
MASTER'S DEGREE
100.0/ 100
METRIC RATING
18th/ 347
METRIC RANK
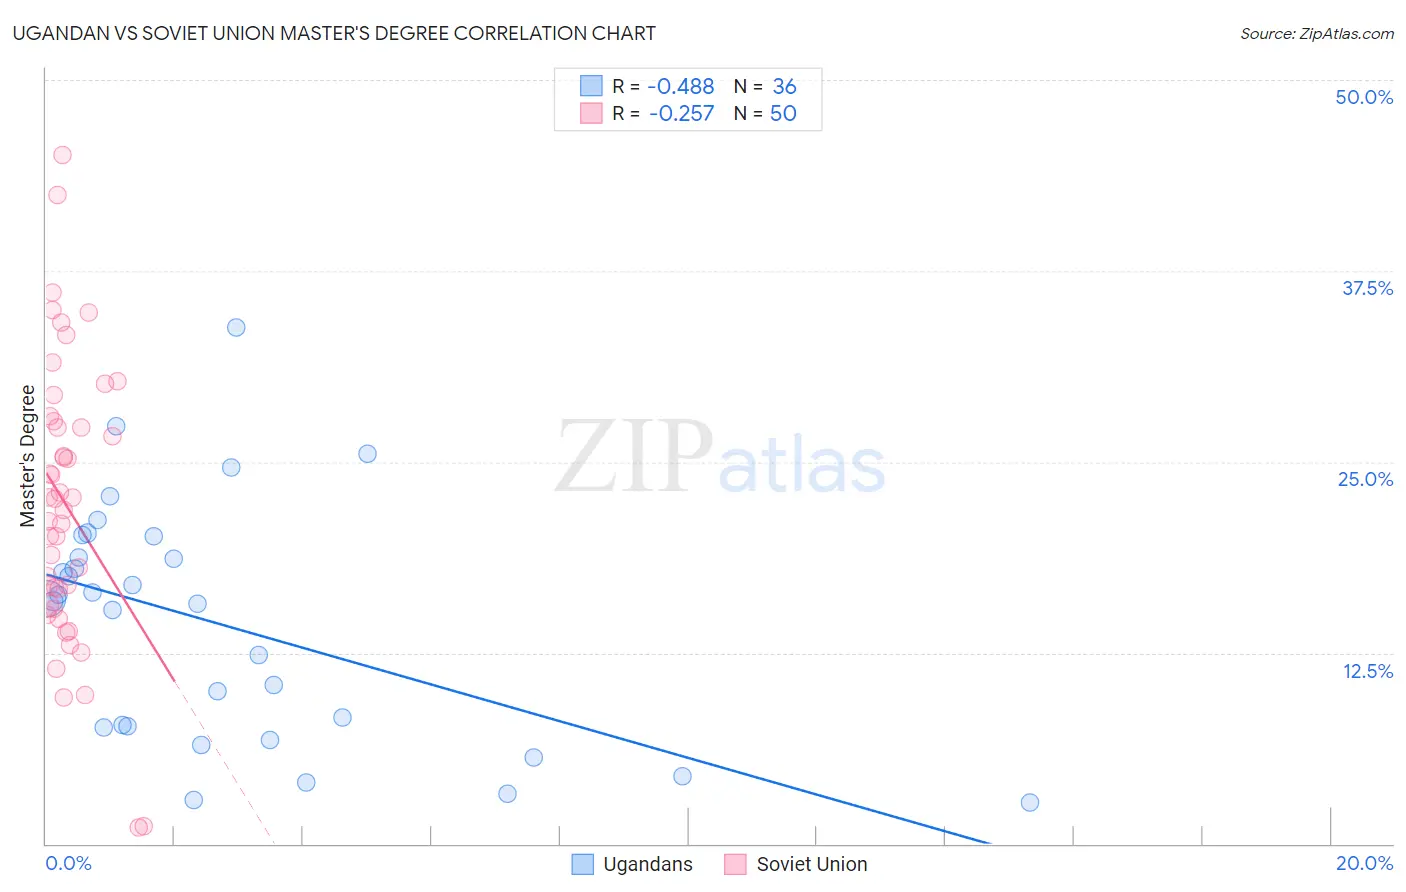
Ugandan vs Soviet Union Master's Degree Correlation Chart
The statistical analysis conducted on geographies consisting of 93,998,017 people shows a moderate negative correlation between the proportion of Ugandans and percentage of population with at least master's degree education in the United States with a correlation coefficient (R) of -0.488 and weighted average of 17.1%. Similarly, the statistical analysis conducted on geographies consisting of 43,514,626 people shows a weak negative correlation between the proportion of Soviet Union and percentage of population with at least master's degree education in the United States with a correlation coefficient (R) of -0.257 and weighted average of 20.5%, a difference of 19.8%.
Master's Degree Correlation Summary
| Measurement | Ugandan | Soviet Union |
| Minimum | 2.7% | 1.0% |
| Maximum | 33.8% | 45.1% |
| Range | 31.1% | 44.1% |
| Mean | 14.4% | 22.1% |
| Median | 16.0% | 22.2% |
| Interquartile 25% (IQ1) | 7.7% | 15.6% |
| Interquartile 75% (IQ3) | 19.4% | 27.6% |
| Interquartile Range (IQR) | 11.8% | 12.0% |
| Standard Deviation (Sample) | 7.7% | 9.2% |
| Standard Deviation (Population) | 7.6% | 9.1% |
Similar Demographics by Master's Degree
Demographics Similar to Ugandans by Master's Degree
In terms of master's degree, the demographic groups most similar to Ugandans are Immigrants from Italy (17.2%, a difference of 0.13%), Immigrants from North America (17.2%, a difference of 0.19%), Romanian (17.2%, a difference of 0.24%), Immigrants from Egypt (17.2%, a difference of 0.31%), and Immigrants from Morocco (17.1%, a difference of 0.32%).
| Demographics | Rating | Rank | Master's Degree |
| Maltese | 99.3 /100 | #87 | Exceptional 17.3% |
| Immigrants | Canada | 99.2 /100 | #88 | Exceptional 17.2% |
| Bhutanese | 99.1 /100 | #89 | Exceptional 17.2% |
| Immigrants | Egypt | 99.1 /100 | #90 | Exceptional 17.2% |
| Romanians | 99.1 /100 | #91 | Exceptional 17.2% |
| Immigrants | North America | 99.1 /100 | #92 | Exceptional 17.2% |
| Immigrants | Italy | 99.1 /100 | #93 | Exceptional 17.2% |
| Ugandans | 99.0 /100 | #94 | Exceptional 17.1% |
| Immigrants | Morocco | 98.9 /100 | #95 | Exceptional 17.1% |
| Immigrants | Northern Africa | 98.9 /100 | #96 | Exceptional 17.1% |
| Immigrants | England | 98.8 /100 | #97 | Exceptional 17.0% |
| Immigrants | Ukraine | 98.8 /100 | #98 | Exceptional 17.0% |
| Laotians | 98.8 /100 | #99 | Exceptional 17.0% |
| Albanians | 98.7 /100 | #100 | Exceptional 17.0% |
| Immigrants | Nepal | 98.6 /100 | #101 | Exceptional 17.0% |
Demographics Similar to Soviet Union by Master's Degree
In terms of master's degree, the demographic groups most similar to Soviet Union are Immigrants from Hong Kong (20.5%, a difference of 0.35%), Indian (Asian) (20.5%, a difference of 0.37%), Immigrants from Ireland (20.4%, a difference of 0.48%), Israeli (20.3%, a difference of 0.90%), and Immigrants from South Central Asia (20.7%, a difference of 0.92%).
| Demographics | Rating | Rank | Master's Degree |
| Immigrants | China | 100.0 /100 | #11 | Exceptional 21.2% |
| Eastern Europeans | 100.0 /100 | #12 | Exceptional 21.1% |
| Immigrants | Australia | 100.0 /100 | #13 | Exceptional 20.9% |
| Immigrants | Switzerland | 100.0 /100 | #14 | Exceptional 20.9% |
| Immigrants | Eastern Asia | 100.0 /100 | #15 | Exceptional 20.8% |
| Immigrants | Belgium | 100.0 /100 | #16 | Exceptional 20.8% |
| Immigrants | South Central Asia | 100.0 /100 | #17 | Exceptional 20.7% |
| Soviet Union | 100.0 /100 | #18 | Exceptional 20.5% |
| Immigrants | Hong Kong | 100.0 /100 | #19 | Exceptional 20.5% |
| Indians (Asian) | 100.0 /100 | #20 | Exceptional 20.5% |
| Immigrants | Ireland | 100.0 /100 | #21 | Exceptional 20.4% |
| Israelis | 100.0 /100 | #22 | Exceptional 20.3% |
| Immigrants | France | 100.0 /100 | #23 | Exceptional 20.3% |
| Immigrants | Sweden | 100.0 /100 | #24 | Exceptional 20.3% |
| Immigrants | Japan | 100.0 /100 | #25 | Exceptional 20.0% |