Maltese vs Jordanian Single Female Poverty
COMPARE
Maltese
Jordanian
Single Female Poverty
Single Female Poverty Comparison
Maltese
Jordanians
18.3%
SINGLE FEMALE POVERTY
100.0/ 100
METRIC RATING
21st/ 347
METRIC RANK
18.8%
SINGLE FEMALE POVERTY
99.9/ 100
METRIC RATING
42nd/ 347
METRIC RANK
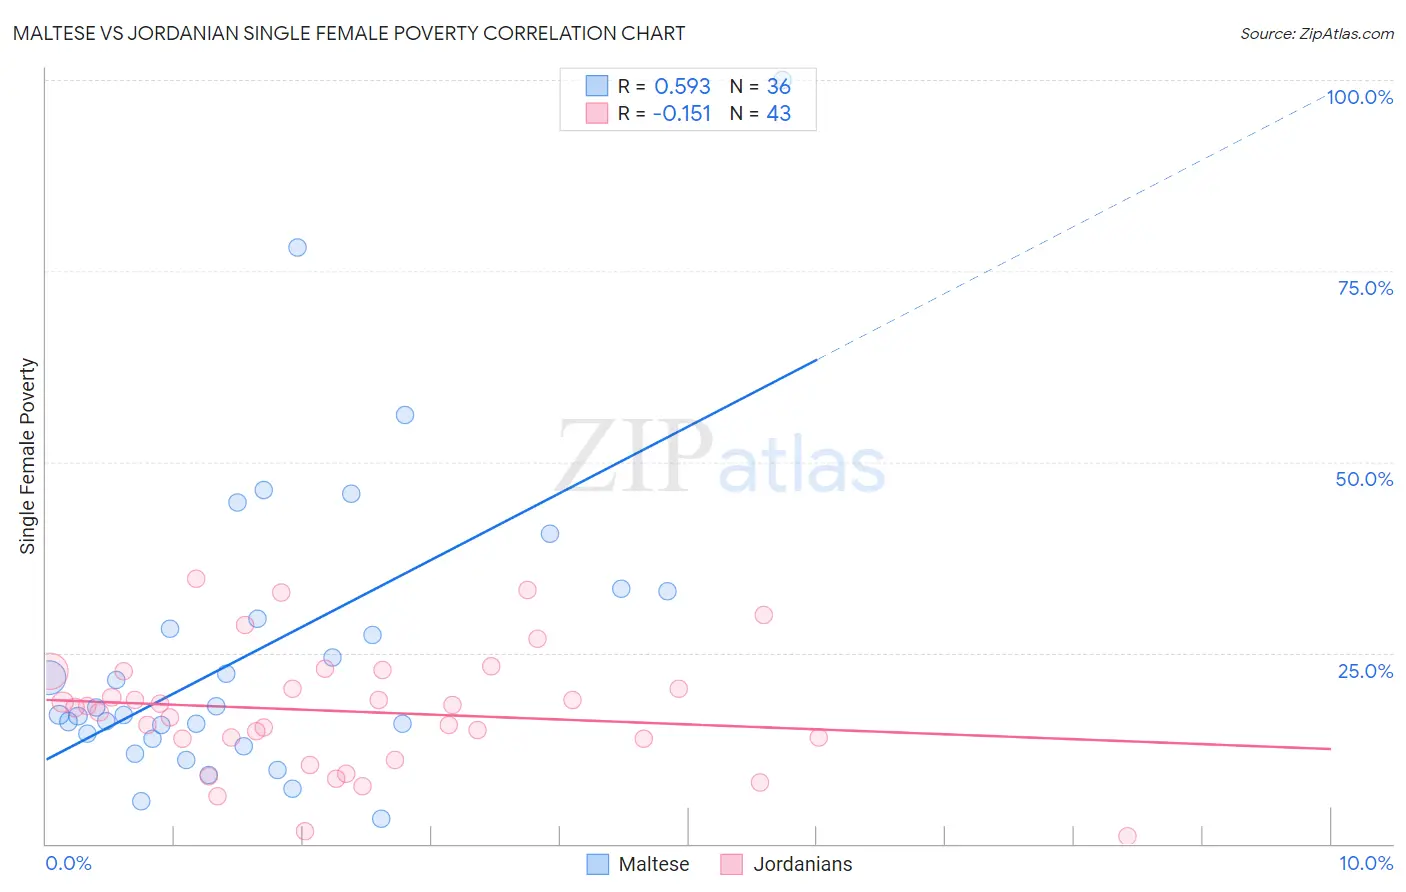
Maltese vs Jordanian Single Female Poverty Correlation Chart
The statistical analysis conducted on geographies consisting of 125,419,200 people shows a substantial positive correlation between the proportion of Maltese and poverty level among single females in the United States with a correlation coefficient (R) of 0.593 and weighted average of 18.3%. Similarly, the statistical analysis conducted on geographies consisting of 165,541,615 people shows a poor negative correlation between the proportion of Jordanians and poverty level among single females in the United States with a correlation coefficient (R) of -0.151 and weighted average of 18.8%, a difference of 2.9%.
Single Female Poverty Correlation Summary
| Measurement | Maltese | Jordanian |
| Minimum | 3.3% | 1.0% |
| Maximum | 100.0% | 34.8% |
| Range | 96.7% | 33.7% |
| Mean | 25.4% | 17.3% |
| Median | 17.4% | 17.8% |
| Interquartile 25% (IQ1) | 14.1% | 13.7% |
| Interquartile 75% (IQ3) | 31.2% | 22.5% |
| Interquartile Range (IQR) | 17.1% | 8.8% |
| Standard Deviation (Sample) | 20.2% | 7.8% |
| Standard Deviation (Population) | 19.9% | 7.7% |
Similar Demographics by Single Female Poverty
Demographics Similar to Maltese by Single Female Poverty
In terms of single female poverty, the demographic groups most similar to Maltese are Burmese (18.3%, a difference of 0.010%), Asian (18.3%, a difference of 0.020%), Immigrants from Greece (18.3%, a difference of 0.060%), Armenian (18.3%, a difference of 0.24%), and Immigrants from Singapore (18.3%, a difference of 0.34%).
| Demographics | Rating | Rank | Single Female Poverty |
| Bolivians | 100.0 /100 | #14 | Exceptional 17.9% |
| Indians (Asian) | 100.0 /100 | #15 | Exceptional 17.9% |
| Iranians | 100.0 /100 | #16 | Exceptional 18.0% |
| Immigrants | Korea | 100.0 /100 | #17 | Exceptional 18.1% |
| Immigrants | Eastern Asia | 100.0 /100 | #18 | Exceptional 18.1% |
| Immigrants | China | 100.0 /100 | #19 | Exceptional 18.1% |
| Immigrants | Greece | 100.0 /100 | #20 | Exceptional 18.3% |
| Maltese | 100.0 /100 | #21 | Exceptional 18.3% |
| Burmese | 100.0 /100 | #22 | Exceptional 18.3% |
| Asians | 100.0 /100 | #23 | Exceptional 18.3% |
| Armenians | 100.0 /100 | #24 | Exceptional 18.3% |
| Immigrants | Singapore | 100.0 /100 | #25 | Exceptional 18.3% |
| Immigrants | Israel | 100.0 /100 | #26 | Exceptional 18.3% |
| Immigrants | Pakistan | 100.0 /100 | #27 | Exceptional 18.4% |
| Immigrants | Moldova | 100.0 /100 | #28 | Exceptional 18.5% |
Demographics Similar to Jordanians by Single Female Poverty
In terms of single female poverty, the demographic groups most similar to Jordanians are Immigrants from Serbia (18.8%, a difference of 0.080%), Okinawan (18.8%, a difference of 0.090%), Bulgarian (18.8%, a difference of 0.13%), Immigrants from Romania (18.8%, a difference of 0.15%), and Tongan (18.8%, a difference of 0.16%).
| Demographics | Rating | Rank | Single Female Poverty |
| Immigrants | Japan | 99.9 /100 | #35 | Exceptional 18.6% |
| Turks | 99.9 /100 | #36 | Exceptional 18.7% |
| Immigrants | Armenia | 99.9 /100 | #37 | Exceptional 18.7% |
| Tongans | 99.9 /100 | #38 | Exceptional 18.8% |
| Bulgarians | 99.9 /100 | #39 | Exceptional 18.8% |
| Okinawans | 99.9 /100 | #40 | Exceptional 18.8% |
| Immigrants | Serbia | 99.9 /100 | #41 | Exceptional 18.8% |
| Jordanians | 99.9 /100 | #42 | Exceptional 18.8% |
| Immigrants | Romania | 99.9 /100 | #43 | Exceptional 18.8% |
| Immigrants | Croatia | 99.9 /100 | #44 | Exceptional 18.9% |
| Immigrants | Indonesia | 99.8 /100 | #45 | Exceptional 18.9% |
| Macedonians | 99.8 /100 | #46 | Exceptional 18.9% |
| Latvians | 99.8 /100 | #47 | Exceptional 19.0% |
| Immigrants | Argentina | 99.8 /100 | #48 | Exceptional 19.0% |
| Immigrants | Czechoslovakia | 99.8 /100 | #49 | Exceptional 19.0% |