Immigrants from South Africa vs Jordanian Single Female Poverty
COMPARE
Immigrants from South Africa
Jordanian
Single Female Poverty
Single Female Poverty Comparison
Immigrants from South Africa
Jordanians
20.1%
SINGLE FEMALE POVERTY
93.9/ 100
METRIC RATING
125th/ 347
METRIC RANK
18.8%
SINGLE FEMALE POVERTY
99.9/ 100
METRIC RATING
42nd/ 347
METRIC RANK
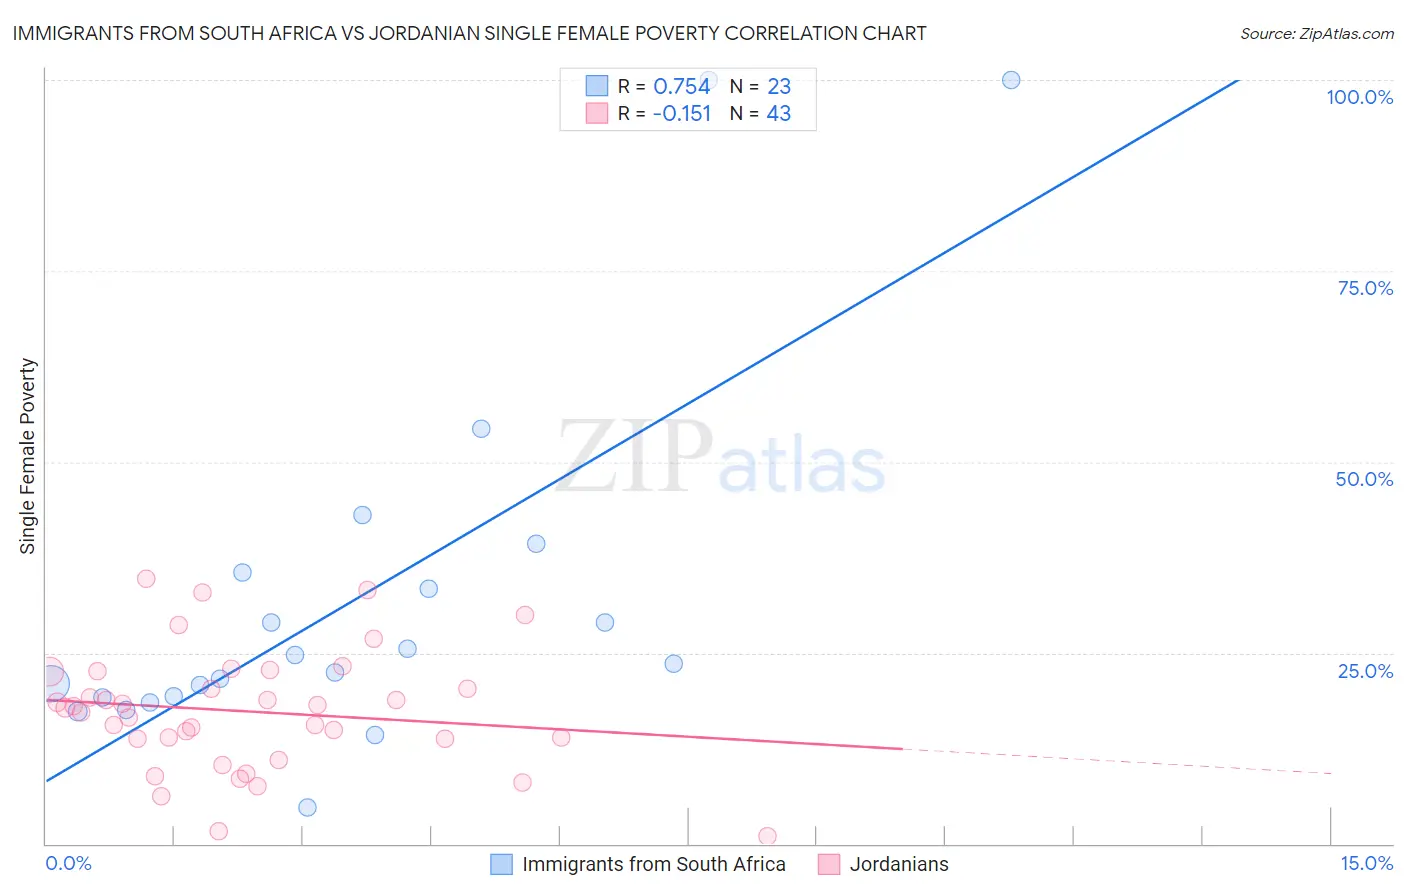
Immigrants from South Africa vs Jordanian Single Female Poverty Correlation Chart
The statistical analysis conducted on geographies consisting of 230,419,478 people shows a strong positive correlation between the proportion of Immigrants from South Africa and poverty level among single females in the United States with a correlation coefficient (R) of 0.754 and weighted average of 20.1%. Similarly, the statistical analysis conducted on geographies consisting of 165,541,615 people shows a poor negative correlation between the proportion of Jordanians and poverty level among single females in the United States with a correlation coefficient (R) of -0.151 and weighted average of 18.8%, a difference of 6.9%.
Single Female Poverty Correlation Summary
| Measurement | Immigrants from South Africa | Jordanian |
| Minimum | 4.7% | 1.0% |
| Maximum | 100.0% | 34.8% |
| Range | 95.3% | 33.7% |
| Mean | 31.9% | 17.3% |
| Median | 23.5% | 17.8% |
| Interquartile 25% (IQ1) | 19.1% | 13.7% |
| Interquartile 75% (IQ3) | 35.4% | 22.5% |
| Interquartile Range (IQR) | 16.3% | 8.8% |
| Standard Deviation (Sample) | 23.9% | 7.8% |
| Standard Deviation (Population) | 23.4% | 7.7% |
Similar Demographics by Single Female Poverty
Demographics Similar to Immigrants from South Africa by Single Female Poverty
In terms of single female poverty, the demographic groups most similar to Immigrants from South Africa are Immigrants from Chile (20.1%, a difference of 0.12%), Brazilian (20.1%, a difference of 0.15%), Serbian (20.1%, a difference of 0.17%), Mongolian (20.2%, a difference of 0.19%), and Immigrants from Spain (20.2%, a difference of 0.31%).
| Demographics | Rating | Rank | Single Female Poverty |
| Immigrants | Afghanistan | 95.4 /100 | #118 | Exceptional 20.0% |
| Immigrants | Ethiopia | 95.4 /100 | #119 | Exceptional 20.0% |
| South Americans | 95.1 /100 | #120 | Exceptional 20.0% |
| Immigrants | Switzerland | 95.1 /100 | #121 | Exceptional 20.0% |
| Immigrants | South America | 95.0 /100 | #122 | Exceptional 20.0% |
| Brazilians | 94.4 /100 | #123 | Exceptional 20.1% |
| Immigrants | Chile | 94.3 /100 | #124 | Exceptional 20.1% |
| Immigrants | South Africa | 93.9 /100 | #125 | Exceptional 20.1% |
| Serbians | 93.3 /100 | #126 | Exceptional 20.1% |
| Mongolians | 93.2 /100 | #127 | Exceptional 20.2% |
| Immigrants | Spain | 92.7 /100 | #128 | Exceptional 20.2% |
| Immigrants | Morocco | 92.4 /100 | #129 | Exceptional 20.2% |
| Immigrants | Hungary | 92.3 /100 | #130 | Exceptional 20.2% |
| Pakistanis | 92.1 /100 | #131 | Exceptional 20.2% |
| Uruguayans | 92.1 /100 | #132 | Exceptional 20.2% |
Demographics Similar to Jordanians by Single Female Poverty
In terms of single female poverty, the demographic groups most similar to Jordanians are Immigrants from Serbia (18.8%, a difference of 0.080%), Okinawan (18.8%, a difference of 0.090%), Bulgarian (18.8%, a difference of 0.13%), Immigrants from Romania (18.8%, a difference of 0.15%), and Tongan (18.8%, a difference of 0.16%).
| Demographics | Rating | Rank | Single Female Poverty |
| Immigrants | Japan | 99.9 /100 | #35 | Exceptional 18.6% |
| Turks | 99.9 /100 | #36 | Exceptional 18.7% |
| Immigrants | Armenia | 99.9 /100 | #37 | Exceptional 18.7% |
| Tongans | 99.9 /100 | #38 | Exceptional 18.8% |
| Bulgarians | 99.9 /100 | #39 | Exceptional 18.8% |
| Okinawans | 99.9 /100 | #40 | Exceptional 18.8% |
| Immigrants | Serbia | 99.9 /100 | #41 | Exceptional 18.8% |
| Jordanians | 99.9 /100 | #42 | Exceptional 18.8% |
| Immigrants | Romania | 99.9 /100 | #43 | Exceptional 18.8% |
| Immigrants | Croatia | 99.9 /100 | #44 | Exceptional 18.9% |
| Immigrants | Indonesia | 99.8 /100 | #45 | Exceptional 18.9% |
| Macedonians | 99.8 /100 | #46 | Exceptional 18.9% |
| Latvians | 99.8 /100 | #47 | Exceptional 19.0% |
| Immigrants | Argentina | 99.8 /100 | #48 | Exceptional 19.0% |
| Immigrants | Czechoslovakia | 99.8 /100 | #49 | Exceptional 19.0% |