Tsimshian vs Jordanian In Labor Force | Age 35-44
COMPARE
Tsimshian
Jordanian
In Labor Force | Age 35-44
In Labor Force | Age 35-44 Comparison
Tsimshian
Jordanians
83.5%
IN LABOR FORCE | AGE 35-44
0.2/ 100
METRIC RATING
258th/ 347
METRIC RANK
84.4%
IN LABOR FORCE | AGE 35-44
51.7/ 100
METRIC RATING
171st/ 347
METRIC RANK
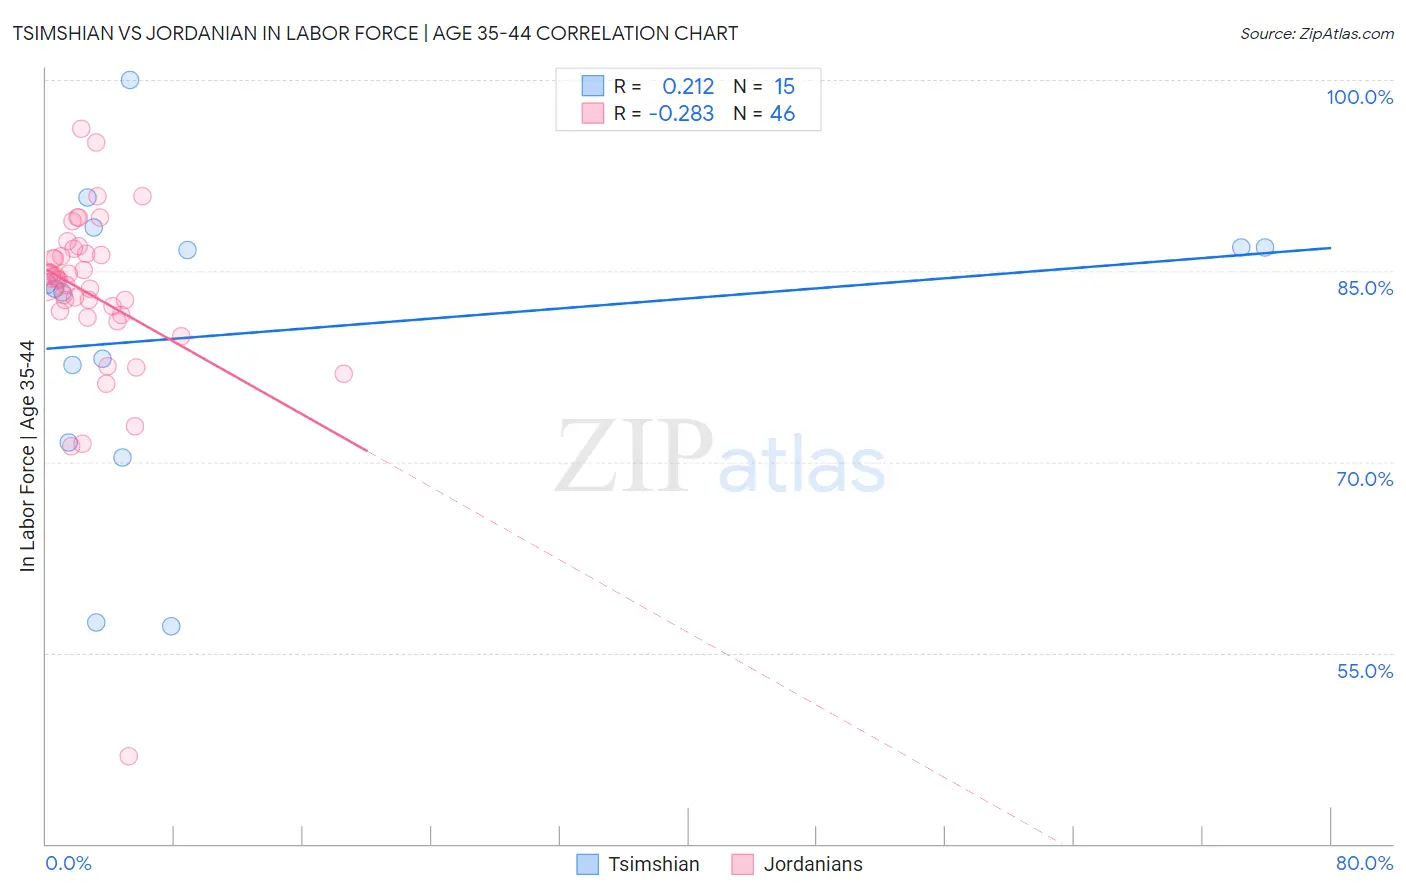
Tsimshian vs Jordanian In Labor Force | Age 35-44 Correlation Chart
The statistical analysis conducted on geographies consisting of 15,626,462 people shows a weak positive correlation between the proportion of Tsimshian and labor force participation rate among population between the ages 35 and 44 in the United States with a correlation coefficient (R) of 0.212 and weighted average of 83.5%. Similarly, the statistical analysis conducted on geographies consisting of 166,398,743 people shows a weak negative correlation between the proportion of Jordanians and labor force participation rate among population between the ages 35 and 44 in the United States with a correlation coefficient (R) of -0.283 and weighted average of 84.4%, a difference of 0.99%.
In Labor Force | Age 35-44 Correlation Summary
| Measurement | Tsimshian | Jordanian |
| Minimum | 57.1% | 46.9% |
| Maximum | 100.0% | 96.2% |
| Range | 42.9% | 49.3% |
| Mean | 80.2% | 83.1% |
| Median | 83.6% | 84.3% |
| Interquartile 25% (IQ1) | 71.6% | 81.5% |
| Interquartile 75% (IQ3) | 86.8% | 86.3% |
| Interquartile Range (IQR) | 15.2% | 4.8% |
| Standard Deviation (Sample) | 11.9% | 7.5% |
| Standard Deviation (Population) | 11.5% | 7.5% |
Similar Demographics by In Labor Force | Age 35-44
Demographics Similar to Tsimshian by In Labor Force | Age 35-44
In terms of in labor force | age 35-44, the demographic groups most similar to Tsimshian are Basque (83.6%, a difference of 0.020%), Immigrants from El Salvador (83.5%, a difference of 0.020%), Vietnamese (83.5%, a difference of 0.030%), Japanese (83.6%, a difference of 0.040%), and Immigrants from Dominica (83.5%, a difference of 0.040%).
| Demographics | Rating | Rank | In Labor Force | Age 35-44 |
| Salvadorans | 0.4 /100 | #251 | Tragic 83.6% |
| Immigrants | Guyana | 0.4 /100 | #252 | Tragic 83.6% |
| Lebanese | 0.4 /100 | #253 | Tragic 83.6% |
| Tongans | 0.4 /100 | #254 | Tragic 83.6% |
| Immigrants | Azores | 0.3 /100 | #255 | Tragic 83.6% |
| Japanese | 0.3 /100 | #256 | Tragic 83.6% |
| Basques | 0.3 /100 | #257 | Tragic 83.6% |
| Tsimshian | 0.2 /100 | #258 | Tragic 83.5% |
| Immigrants | El Salvador | 0.2 /100 | #259 | Tragic 83.5% |
| Vietnamese | 0.2 /100 | #260 | Tragic 83.5% |
| Immigrants | Dominica | 0.2 /100 | #261 | Tragic 83.5% |
| Immigrants | Congo | 0.2 /100 | #262 | Tragic 83.5% |
| Iroquois | 0.2 /100 | #263 | Tragic 83.5% |
| Scotch-Irish | 0.1 /100 | #264 | Tragic 83.5% |
| Central Americans | 0.1 /100 | #265 | Tragic 83.5% |
Demographics Similar to Jordanians by In Labor Force | Age 35-44
In terms of in labor force | age 35-44, the demographic groups most similar to Jordanians are Immigrants from Jordan (84.4%, a difference of 0.0%), Scandinavian (84.4%, a difference of 0.0%), Irish (84.4%, a difference of 0.010%), Immigrants from Afghanistan (84.4%, a difference of 0.010%), and Immigrants from Trinidad and Tobago (84.4%, a difference of 0.010%).
| Demographics | Rating | Rank | In Labor Force | Age 35-44 |
| Nigerians | 58.9 /100 | #164 | Average 84.4% |
| Venezuelans | 58.1 /100 | #165 | Average 84.4% |
| Alsatians | 55.2 /100 | #166 | Average 84.4% |
| Immigrants | Portugal | 55.2 /100 | #167 | Average 84.4% |
| Irish | 53.1 /100 | #168 | Average 84.4% |
| Immigrants | Afghanistan | 52.7 /100 | #169 | Average 84.4% |
| Immigrants | Jordan | 52.5 /100 | #170 | Average 84.4% |
| Jordanians | 51.7 /100 | #171 | Average 84.4% |
| Scandinavians | 51.2 /100 | #172 | Average 84.4% |
| Immigrants | Trinidad and Tobago | 50.7 /100 | #173 | Average 84.4% |
| Immigrants | Iran | 50.0 /100 | #174 | Average 84.4% |
| Pakistanis | 48.2 /100 | #175 | Average 84.4% |
| Sri Lankans | 47.3 /100 | #176 | Average 84.4% |
| French Canadians | 44.3 /100 | #177 | Average 84.3% |
| Northern Europeans | 44.1 /100 | #178 | Average 84.3% |