Pueblo vs Inupiat Single Female Poverty
COMPARE
Pueblo
Inupiat
Single Female Poverty
Single Female Poverty Comparison
Pueblo
Inupiat
28.6%
SINGLE FEMALE POVERTY
0.0/ 100
METRIC RATING
334th/ 347
METRIC RANK
23.1%
SINGLE FEMALE POVERTY
0.2/ 100
METRIC RATING
270th/ 347
METRIC RANK
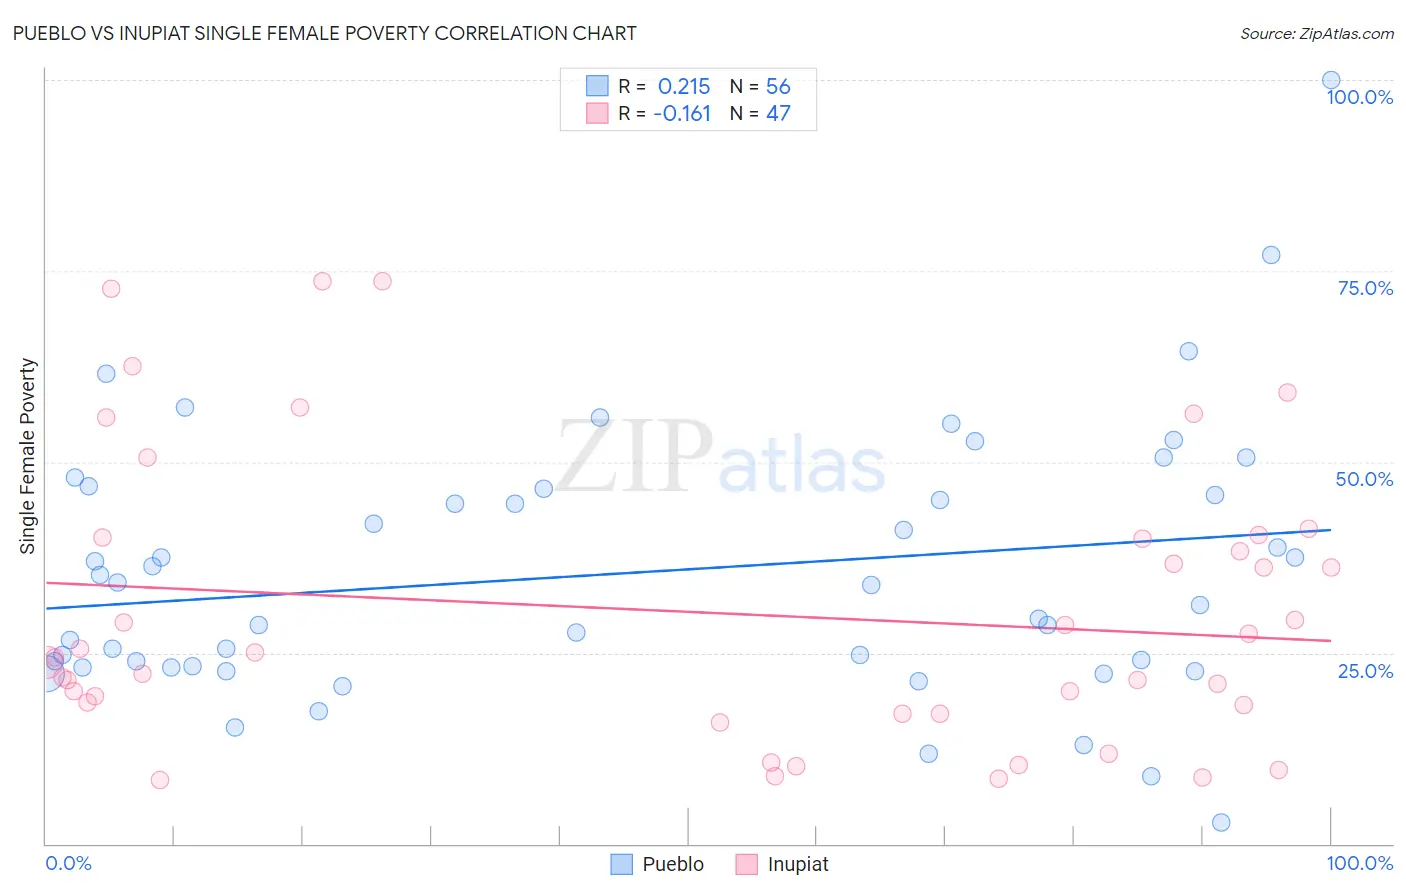
Pueblo vs Inupiat Single Female Poverty Correlation Chart
The statistical analysis conducted on geographies consisting of 119,546,041 people shows a weak positive correlation between the proportion of Pueblo and poverty level among single females in the United States with a correlation coefficient (R) of 0.215 and weighted average of 28.6%. Similarly, the statistical analysis conducted on geographies consisting of 95,986,972 people shows a poor negative correlation between the proportion of Inupiat and poverty level among single females in the United States with a correlation coefficient (R) of -0.161 and weighted average of 23.1%, a difference of 23.7%.
Single Female Poverty Correlation Summary
| Measurement | Pueblo | Inupiat |
| Minimum | 2.9% | 8.3% |
| Maximum | 100.0% | 73.6% |
| Range | 97.1% | 65.3% |
| Mean | 35.5% | 30.3% |
| Median | 32.6% | 24.4% |
| Interquartile 25% (IQ1) | 23.2% | 17.1% |
| Interquartile 75% (IQ3) | 46.1% | 40.1% |
| Interquartile Range (IQR) | 22.9% | 23.1% |
| Standard Deviation (Sample) | 17.5% | 18.6% |
| Standard Deviation (Population) | 17.4% | 18.4% |
Similar Demographics by Single Female Poverty
Demographics Similar to Pueblo by Single Female Poverty
In terms of single female poverty, the demographic groups most similar to Pueblo are Ute (28.4%, a difference of 0.73%), Immigrants from Yemen (28.9%, a difference of 1.1%), Yakama (28.3%, a difference of 1.1%), Native/Alaskan (28.2%, a difference of 1.4%), and Colville (29.1%, a difference of 1.6%).
| Demographics | Rating | Rank | Single Female Poverty |
| Dutch West Indians | 0.0 /100 | #327 | Tragic 27.5% |
| Apache | 0.0 /100 | #328 | Tragic 27.7% |
| Menominee | 0.0 /100 | #329 | Tragic 27.8% |
| Hopi | 0.0 /100 | #330 | Tragic 28.0% |
| Natives/Alaskans | 0.0 /100 | #331 | Tragic 28.2% |
| Yakama | 0.0 /100 | #332 | Tragic 28.3% |
| Ute | 0.0 /100 | #333 | Tragic 28.4% |
| Pueblo | 0.0 /100 | #334 | Tragic 28.6% |
| Immigrants | Yemen | 0.0 /100 | #335 | Tragic 28.9% |
| Colville | 0.0 /100 | #336 | Tragic 29.1% |
| Yuman | 0.0 /100 | #337 | Tragic 29.4% |
| Pima | 0.0 /100 | #338 | Tragic 30.3% |
| Cheyenne | 0.0 /100 | #339 | Tragic 30.4% |
| Cajuns | 0.0 /100 | #340 | Tragic 30.6% |
| Sioux | 0.0 /100 | #341 | Tragic 31.3% |
Demographics Similar to Inupiat by Single Female Poverty
In terms of single female poverty, the demographic groups most similar to Inupiat are Subsaharan African (23.2%, a difference of 0.25%), Hmong (23.1%, a difference of 0.26%), Fijian (23.1%, a difference of 0.28%), Senegalese (23.0%, a difference of 0.35%), and Immigrants from Micronesia (23.0%, a difference of 0.41%).
| Demographics | Rating | Rank | Single Female Poverty |
| Scotch-Irish | 0.3 /100 | #263 | Tragic 22.9% |
| Immigrants | Laos | 0.3 /100 | #264 | Tragic 22.9% |
| Central Americans | 0.2 /100 | #265 | Tragic 23.0% |
| Immigrants | Micronesia | 0.2 /100 | #266 | Tragic 23.0% |
| Senegalese | 0.2 /100 | #267 | Tragic 23.0% |
| Fijians | 0.2 /100 | #268 | Tragic 23.1% |
| Hmong | 0.2 /100 | #269 | Tragic 23.1% |
| Inupiat | 0.2 /100 | #270 | Tragic 23.1% |
| Sub-Saharan Africans | 0.1 /100 | #271 | Tragic 23.2% |
| Immigrants | Senegal | 0.1 /100 | #272 | Tragic 23.2% |
| Alaska Natives | 0.1 /100 | #273 | Tragic 23.3% |
| Marshallese | 0.1 /100 | #274 | Tragic 23.3% |
| Mexican American Indians | 0.1 /100 | #275 | Tragic 23.4% |
| Immigrants | Azores | 0.0 /100 | #276 | Tragic 23.5% |
| Pennsylvania Germans | 0.0 /100 | #277 | Tragic 23.6% |