Tsimshian vs Immigrants from Ireland Single Father Poverty
COMPARE
Tsimshian
Immigrants from Ireland
Single Father Poverty
Single Father Poverty Comparison
Tsimshian
Immigrants from Ireland
12.7%
SINGLE FATHER POVERTY
100.0/ 100
METRIC RATING
3rd/ 347
METRIC RANK
17.1%
SINGLE FATHER POVERTY
1.4/ 100
METRIC RATING
246th/ 347
METRIC RANK
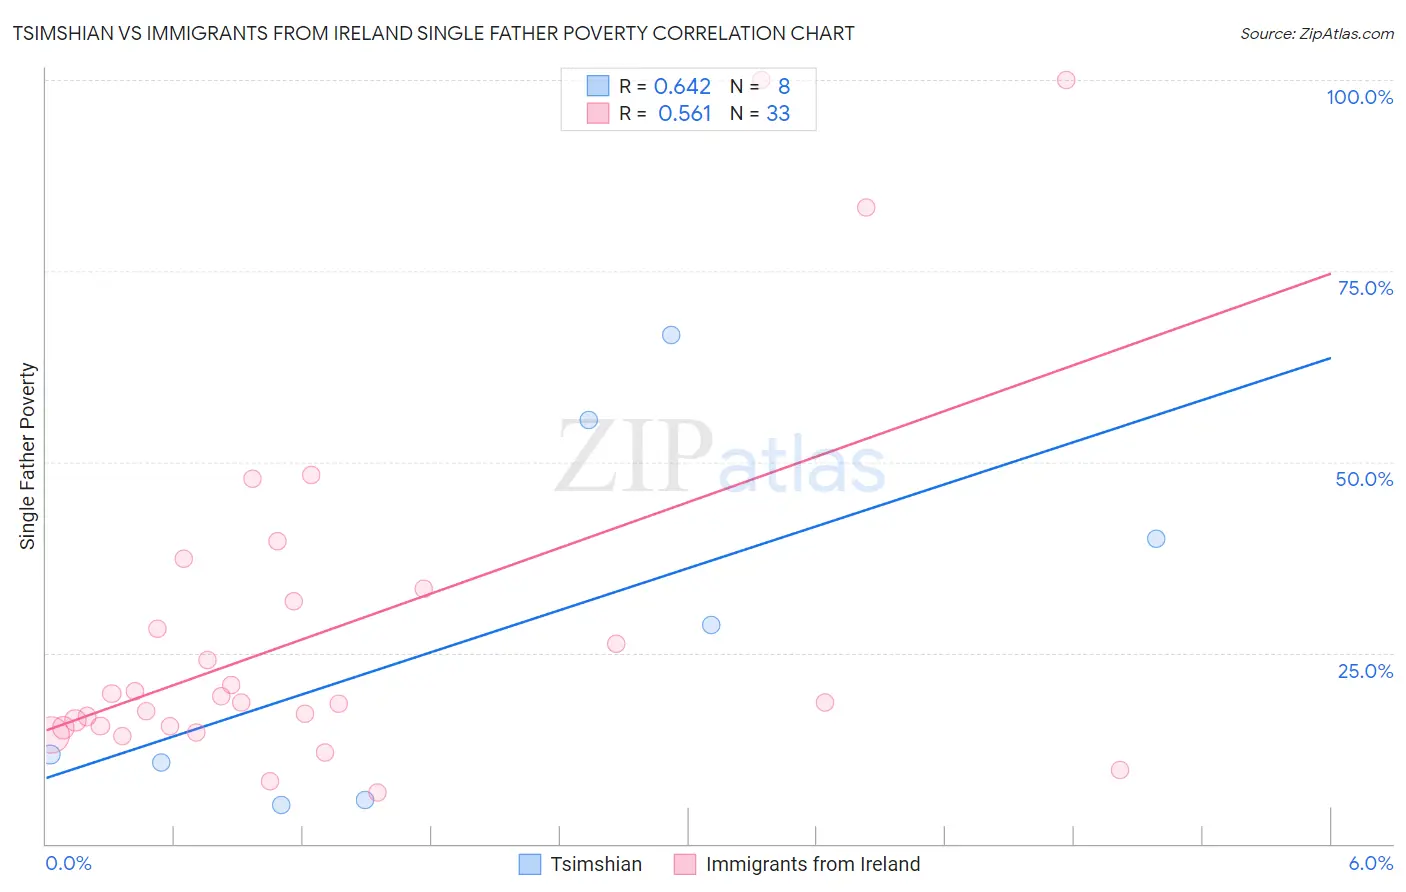
Tsimshian vs Immigrants from Ireland Single Father Poverty Correlation Chart
The statistical analysis conducted on geographies consisting of 14,553,815 people shows a significant positive correlation between the proportion of Tsimshian and poverty level among single fathers in the United States with a correlation coefficient (R) of 0.642 and weighted average of 12.7%. Similarly, the statistical analysis conducted on geographies consisting of 193,149,664 people shows a substantial positive correlation between the proportion of Immigrants from Ireland and poverty level among single fathers in the United States with a correlation coefficient (R) of 0.561 and weighted average of 17.1%, a difference of 34.3%.
Single Father Poverty Correlation Summary
| Measurement | Tsimshian | Immigrants from Ireland |
| Minimum | 5.1% | 6.7% |
| Maximum | 66.7% | 100.0% |
| Range | 61.5% | 93.3% |
| Mean | 28.0% | 28.1% |
| Median | 20.1% | 18.5% |
| Interquartile 25% (IQ1) | 8.1% | 15.3% |
| Interquartile 75% (IQ3) | 47.7% | 32.6% |
| Interquartile Range (IQR) | 39.6% | 17.3% |
| Standard Deviation (Sample) | 23.9% | 23.7% |
| Standard Deviation (Population) | 22.3% | 23.4% |
Similar Demographics by Single Father Poverty
Demographics Similar to Tsimshian by Single Father Poverty
In terms of single father poverty, the demographic groups most similar to Tsimshian are Tongan (12.2%, a difference of 3.9%), Immigrants from Fiji (13.2%, a difference of 4.2%), Immigrants from Ethiopia (13.4%, a difference of 5.9%), Ethiopian (13.5%, a difference of 6.7%), and Immigrants from Taiwan (13.7%, a difference of 7.8%).
| Demographics | Rating | Rank | Single Father Poverty |
| Assyrians/Chaldeans/Syriacs | 100.0 /100 | #1 | Exceptional 11.7% |
| Tongans | 100.0 /100 | #2 | Exceptional 12.2% |
| Tsimshian | 100.0 /100 | #3 | Exceptional 12.7% |
| Immigrants | Fiji | 100.0 /100 | #4 | Exceptional 13.2% |
| Immigrants | Ethiopia | 100.0 /100 | #5 | Exceptional 13.4% |
| Ethiopians | 100.0 /100 | #6 | Exceptional 13.5% |
| Immigrants | Taiwan | 100.0 /100 | #7 | Exceptional 13.7% |
| Samoans | 100.0 /100 | #8 | Exceptional 13.8% |
| Afghans | 100.0 /100 | #9 | Exceptional 14.0% |
| Koreans | 100.0 /100 | #10 | Exceptional 14.0% |
| Filipinos | 100.0 /100 | #11 | Exceptional 14.0% |
| Immigrants | India | 100.0 /100 | #12 | Exceptional 14.0% |
| Immigrants | Philippines | 100.0 /100 | #13 | Exceptional 14.0% |
| Immigrants | Vietnam | 100.0 /100 | #14 | Exceptional 14.1% |
| Sri Lankans | 100.0 /100 | #15 | Exceptional 14.2% |
Demographics Similar to Immigrants from Ireland by Single Father Poverty
In terms of single father poverty, the demographic groups most similar to Immigrants from Ireland are Trinidadian and Tobagonian (17.0%, a difference of 0.040%), Honduran (17.0%, a difference of 0.080%), Immigrants from Cabo Verde (17.0%, a difference of 0.10%), Greek (17.1%, a difference of 0.10%), and Czechoslovakian (17.1%, a difference of 0.10%).
| Demographics | Rating | Rank | Single Father Poverty |
| Bermudans | 2.6 /100 | #239 | Tragic 16.9% |
| Finns | 2.6 /100 | #240 | Tragic 16.9% |
| Czechs | 2.3 /100 | #241 | Tragic 17.0% |
| Moroccans | 2.1 /100 | #242 | Tragic 17.0% |
| Immigrants | Cabo Verde | 1.6 /100 | #243 | Tragic 17.0% |
| Hondurans | 1.6 /100 | #244 | Tragic 17.0% |
| Trinidadians and Tobagonians | 1.5 /100 | #245 | Tragic 17.0% |
| Immigrants | Ireland | 1.4 /100 | #246 | Tragic 17.1% |
| Greeks | 1.3 /100 | #247 | Tragic 17.1% |
| Czechoslovakians | 1.3 /100 | #248 | Tragic 17.1% |
| Canadians | 1.3 /100 | #249 | Tragic 17.1% |
| Austrians | 1.1 /100 | #250 | Tragic 17.1% |
| Luxembourgers | 1.1 /100 | #251 | Tragic 17.1% |
| Croatians | 1.0 /100 | #252 | Tragic 17.1% |
| Cree | 1.0 /100 | #253 | Tragic 17.1% |