Tsimshian vs Immigrants from Guatemala Single Father Poverty
COMPARE
Tsimshian
Immigrants from Guatemala
Single Father Poverty
Single Father Poverty Comparison
Tsimshian
Immigrants from Guatemala
12.7%
SINGLE FATHER POVERTY
100.0/ 100
METRIC RATING
3rd/ 347
METRIC RANK
16.6%
SINGLE FATHER POVERTY
14.8/ 100
METRIC RATING
204th/ 347
METRIC RANK
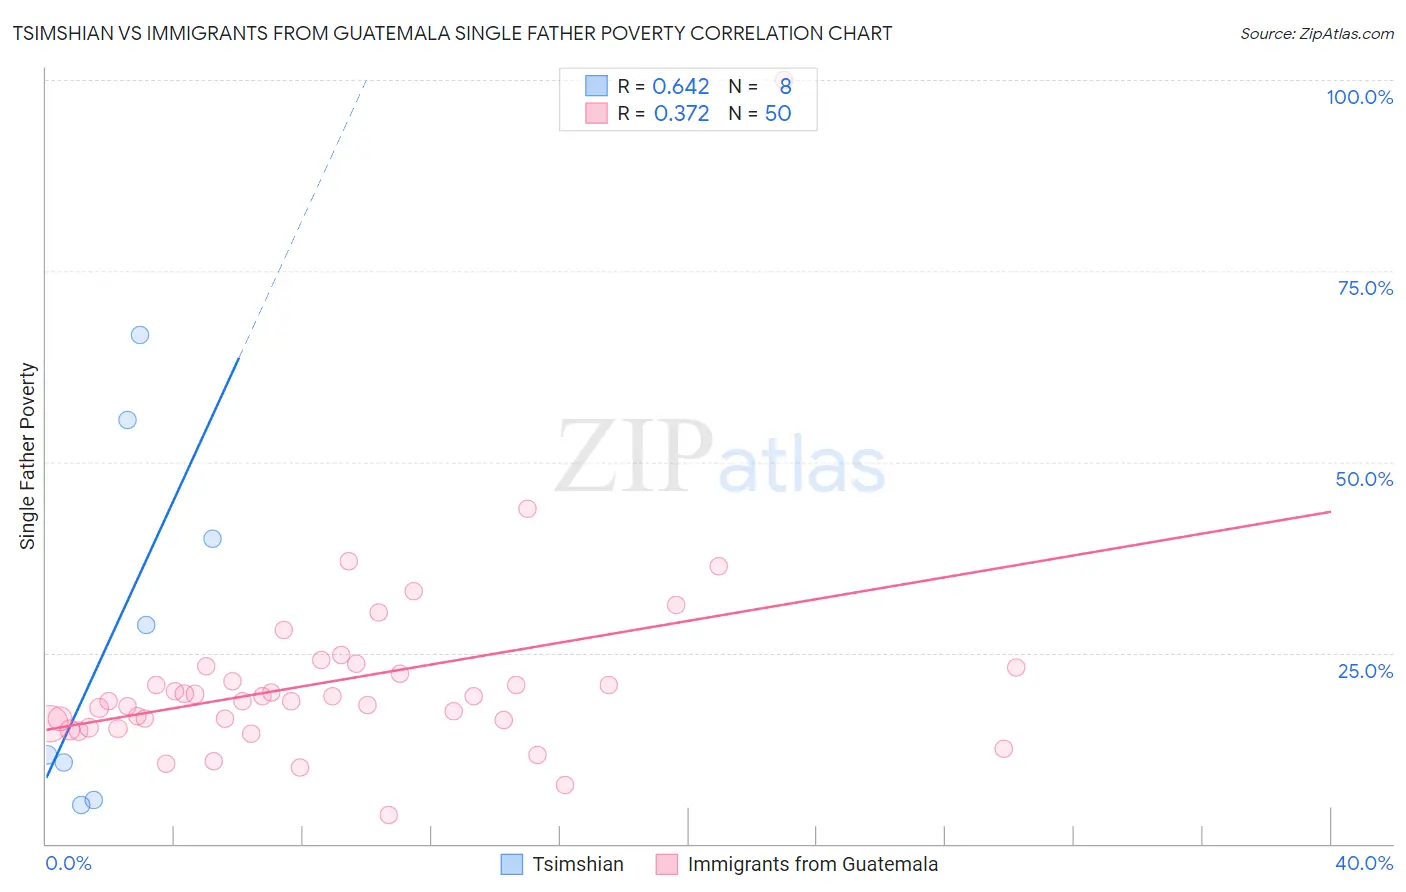
Tsimshian vs Immigrants from Guatemala Single Father Poverty Correlation Chart
The statistical analysis conducted on geographies consisting of 14,553,815 people shows a significant positive correlation between the proportion of Tsimshian and poverty level among single fathers in the United States with a correlation coefficient (R) of 0.642 and weighted average of 12.7%. Similarly, the statistical analysis conducted on geographies consisting of 306,731,498 people shows a mild positive correlation between the proportion of Immigrants from Guatemala and poverty level among single fathers in the United States with a correlation coefficient (R) of 0.372 and weighted average of 16.6%, a difference of 30.8%.
Single Father Poverty Correlation Summary
| Measurement | Tsimshian | Immigrants from Guatemala |
| Minimum | 5.1% | 3.8% |
| Maximum | 66.7% | 100.0% |
| Range | 61.5% | 96.2% |
| Mean | 28.0% | 21.3% |
| Median | 20.1% | 19.0% |
| Interquartile 25% (IQ1) | 8.1% | 15.7% |
| Interquartile 75% (IQ3) | 47.7% | 23.1% |
| Interquartile Range (IQR) | 39.6% | 7.4% |
| Standard Deviation (Sample) | 23.9% | 13.6% |
| Standard Deviation (Population) | 22.3% | 13.5% |
Similar Demographics by Single Father Poverty
Demographics Similar to Tsimshian by Single Father Poverty
In terms of single father poverty, the demographic groups most similar to Tsimshian are Tongan (12.2%, a difference of 3.9%), Immigrants from Fiji (13.2%, a difference of 4.2%), Immigrants from Ethiopia (13.4%, a difference of 5.9%), Ethiopian (13.5%, a difference of 6.7%), and Immigrants from Taiwan (13.7%, a difference of 7.8%).
| Demographics | Rating | Rank | Single Father Poverty |
| Assyrians/Chaldeans/Syriacs | 100.0 /100 | #1 | Exceptional 11.7% |
| Tongans | 100.0 /100 | #2 | Exceptional 12.2% |
| Tsimshian | 100.0 /100 | #3 | Exceptional 12.7% |
| Immigrants | Fiji | 100.0 /100 | #4 | Exceptional 13.2% |
| Immigrants | Ethiopia | 100.0 /100 | #5 | Exceptional 13.4% |
| Ethiopians | 100.0 /100 | #6 | Exceptional 13.5% |
| Immigrants | Taiwan | 100.0 /100 | #7 | Exceptional 13.7% |
| Samoans | 100.0 /100 | #8 | Exceptional 13.8% |
| Afghans | 100.0 /100 | #9 | Exceptional 14.0% |
| Koreans | 100.0 /100 | #10 | Exceptional 14.0% |
| Filipinos | 100.0 /100 | #11 | Exceptional 14.0% |
| Immigrants | India | 100.0 /100 | #12 | Exceptional 14.0% |
| Immigrants | Philippines | 100.0 /100 | #13 | Exceptional 14.0% |
| Immigrants | Vietnam | 100.0 /100 | #14 | Exceptional 14.1% |
| Sri Lankans | 100.0 /100 | #15 | Exceptional 14.2% |
Demographics Similar to Immigrants from Guatemala by Single Father Poverty
In terms of single father poverty, the demographic groups most similar to Immigrants from Guatemala are Immigrants from North America (16.6%, a difference of 0.030%), Venezuelan (16.6%, a difference of 0.040%), Immigrants from Senegal (16.6%, a difference of 0.090%), New Zealander (16.6%, a difference of 0.10%), and Eastern European (16.6%, a difference of 0.10%).
| Demographics | Rating | Rank | Single Father Poverty |
| Immigrants | Northern Europe | 20.3 /100 | #197 | Fair 16.5% |
| Romanians | 20.1 /100 | #198 | Fair 16.5% |
| Immigrants | Belize | 19.8 /100 | #199 | Poor 16.5% |
| Syrians | 17.4 /100 | #200 | Poor 16.6% |
| Cubans | 16.5 /100 | #201 | Poor 16.6% |
| Immigrants | Croatia | 16.5 /100 | #202 | Poor 16.6% |
| Immigrants | North America | 15.1 /100 | #203 | Poor 16.6% |
| Immigrants | Guatemala | 14.8 /100 | #204 | Poor 16.6% |
| Venezuelans | 14.3 /100 | #205 | Poor 16.6% |
| Immigrants | Senegal | 13.7 /100 | #206 | Poor 16.6% |
| New Zealanders | 13.7 /100 | #207 | Poor 16.6% |
| Eastern Europeans | 13.7 /100 | #208 | Poor 16.6% |
| Europeans | 13.2 /100 | #209 | Poor 16.6% |
| Guatemalans | 12.9 /100 | #210 | Poor 16.6% |
| Arabs | 12.8 /100 | #211 | Poor 16.6% |