Tsimshian vs Danish Single Father Poverty
COMPARE
Tsimshian
Danish
Single Father Poverty
Single Father Poverty Comparison
Tsimshian
Danes
12.7%
SINGLE FATHER POVERTY
100.0/ 100
METRIC RATING
3rd/ 347
METRIC RANK
15.8%
SINGLE FATHER POVERTY
94.5/ 100
METRIC RATING
113th/ 347
METRIC RANK
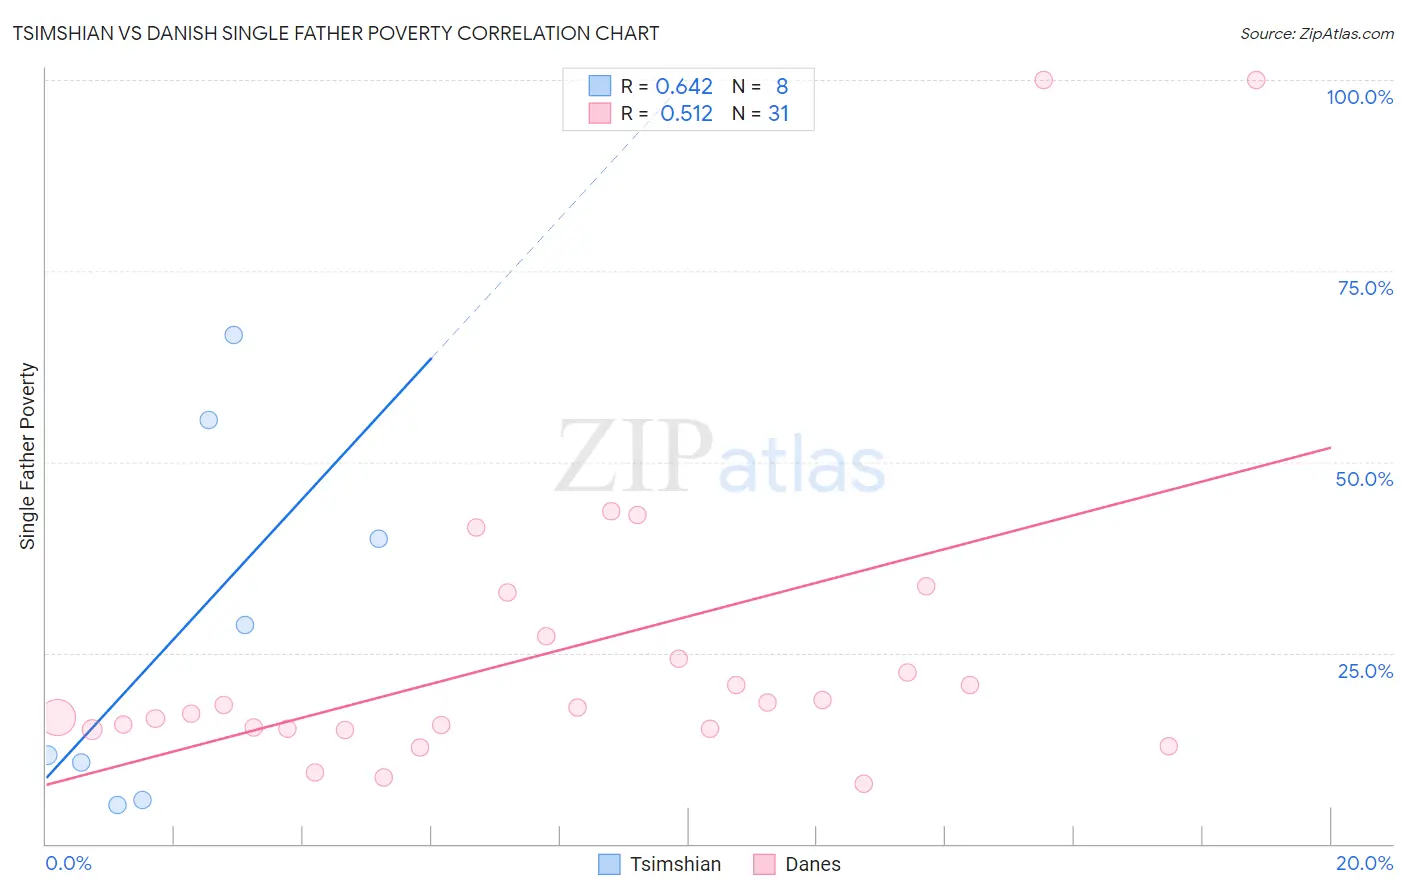
Tsimshian vs Danish Single Father Poverty Correlation Chart
The statistical analysis conducted on geographies consisting of 14,553,815 people shows a significant positive correlation between the proportion of Tsimshian and poverty level among single fathers in the United States with a correlation coefficient (R) of 0.642 and weighted average of 12.7%. Similarly, the statistical analysis conducted on geographies consisting of 352,960,899 people shows a substantial positive correlation between the proportion of Danes and poverty level among single fathers in the United States with a correlation coefficient (R) of 0.512 and weighted average of 15.8%, a difference of 24.3%.
Single Father Poverty Correlation Summary
| Measurement | Tsimshian | Danish |
| Minimum | 5.1% | 7.9% |
| Maximum | 66.7% | 100.0% |
| Range | 61.5% | 92.1% |
| Mean | 28.0% | 25.5% |
| Median | 20.1% | 17.9% |
| Interquartile 25% (IQ1) | 8.1% | 15.1% |
| Interquartile 75% (IQ3) | 47.7% | 27.1% |
| Interquartile Range (IQR) | 39.6% | 12.0% |
| Standard Deviation (Sample) | 23.9% | 22.0% |
| Standard Deviation (Population) | 22.3% | 21.6% |
Similar Demographics by Single Father Poverty
Demographics Similar to Tsimshian by Single Father Poverty
In terms of single father poverty, the demographic groups most similar to Tsimshian are Tongan (12.2%, a difference of 3.9%), Immigrants from Fiji (13.2%, a difference of 4.2%), Immigrants from Ethiopia (13.4%, a difference of 5.9%), Ethiopian (13.5%, a difference of 6.7%), and Immigrants from Taiwan (13.7%, a difference of 7.8%).
| Demographics | Rating | Rank | Single Father Poverty |
| Assyrians/Chaldeans/Syriacs | 100.0 /100 | #1 | Exceptional 11.7% |
| Tongans | 100.0 /100 | #2 | Exceptional 12.2% |
| Tsimshian | 100.0 /100 | #3 | Exceptional 12.7% |
| Immigrants | Fiji | 100.0 /100 | #4 | Exceptional 13.2% |
| Immigrants | Ethiopia | 100.0 /100 | #5 | Exceptional 13.4% |
| Ethiopians | 100.0 /100 | #6 | Exceptional 13.5% |
| Immigrants | Taiwan | 100.0 /100 | #7 | Exceptional 13.7% |
| Samoans | 100.0 /100 | #8 | Exceptional 13.8% |
| Afghans | 100.0 /100 | #9 | Exceptional 14.0% |
| Koreans | 100.0 /100 | #10 | Exceptional 14.0% |
| Filipinos | 100.0 /100 | #11 | Exceptional 14.0% |
| Immigrants | India | 100.0 /100 | #12 | Exceptional 14.0% |
| Immigrants | Philippines | 100.0 /100 | #13 | Exceptional 14.0% |
| Immigrants | Vietnam | 100.0 /100 | #14 | Exceptional 14.1% |
| Sri Lankans | 100.0 /100 | #15 | Exceptional 14.2% |
Demographics Similar to Danes by Single Father Poverty
In terms of single father poverty, the demographic groups most similar to Danes are Argentinean (15.8%, a difference of 0.020%), Immigrants from Latvia (15.8%, a difference of 0.040%), Bulgarian (15.8%, a difference of 0.080%), Immigrants from Africa (15.8%, a difference of 0.13%), and Turkish (15.8%, a difference of 0.14%).
| Demographics | Rating | Rank | Single Father Poverty |
| Immigrants | Poland | 95.8 /100 | #106 | Exceptional 15.7% |
| Native Hawaiians | 95.8 /100 | #107 | Exceptional 15.7% |
| Pakistanis | 95.7 /100 | #108 | Exceptional 15.7% |
| Turks | 95.1 /100 | #109 | Exceptional 15.8% |
| Immigrants | Africa | 95.1 /100 | #110 | Exceptional 15.8% |
| Bulgarians | 94.8 /100 | #111 | Exceptional 15.8% |
| Immigrants | Latvia | 94.7 /100 | #112 | Exceptional 15.8% |
| Danes | 94.5 /100 | #113 | Exceptional 15.8% |
| Argentineans | 94.4 /100 | #114 | Exceptional 15.8% |
| Immigrants | Thailand | 93.6 /100 | #115 | Exceptional 15.8% |
| Immigrants | Argentina | 92.8 /100 | #116 | Exceptional 15.8% |
| Immigrants | Colombia | 92.6 /100 | #117 | Exceptional 15.8% |
| Immigrants | Eastern Europe | 92.5 /100 | #118 | Exceptional 15.8% |
| Immigrants | Belarus | 92.4 /100 | #119 | Exceptional 15.8% |
| Uruguayans | 92.1 /100 | #120 | Exceptional 15.9% |