Tsimshian vs Immigrants from Liberia Single Father Poverty
COMPARE
Tsimshian
Immigrants from Liberia
Single Father Poverty
Single Father Poverty Comparison
Tsimshian
Immigrants from Liberia
12.7%
SINGLE FATHER POVERTY
100.0/ 100
METRIC RATING
3rd/ 347
METRIC RANK
15.9%
SINGLE FATHER POVERTY
91.1/ 100
METRIC RATING
127th/ 347
METRIC RANK
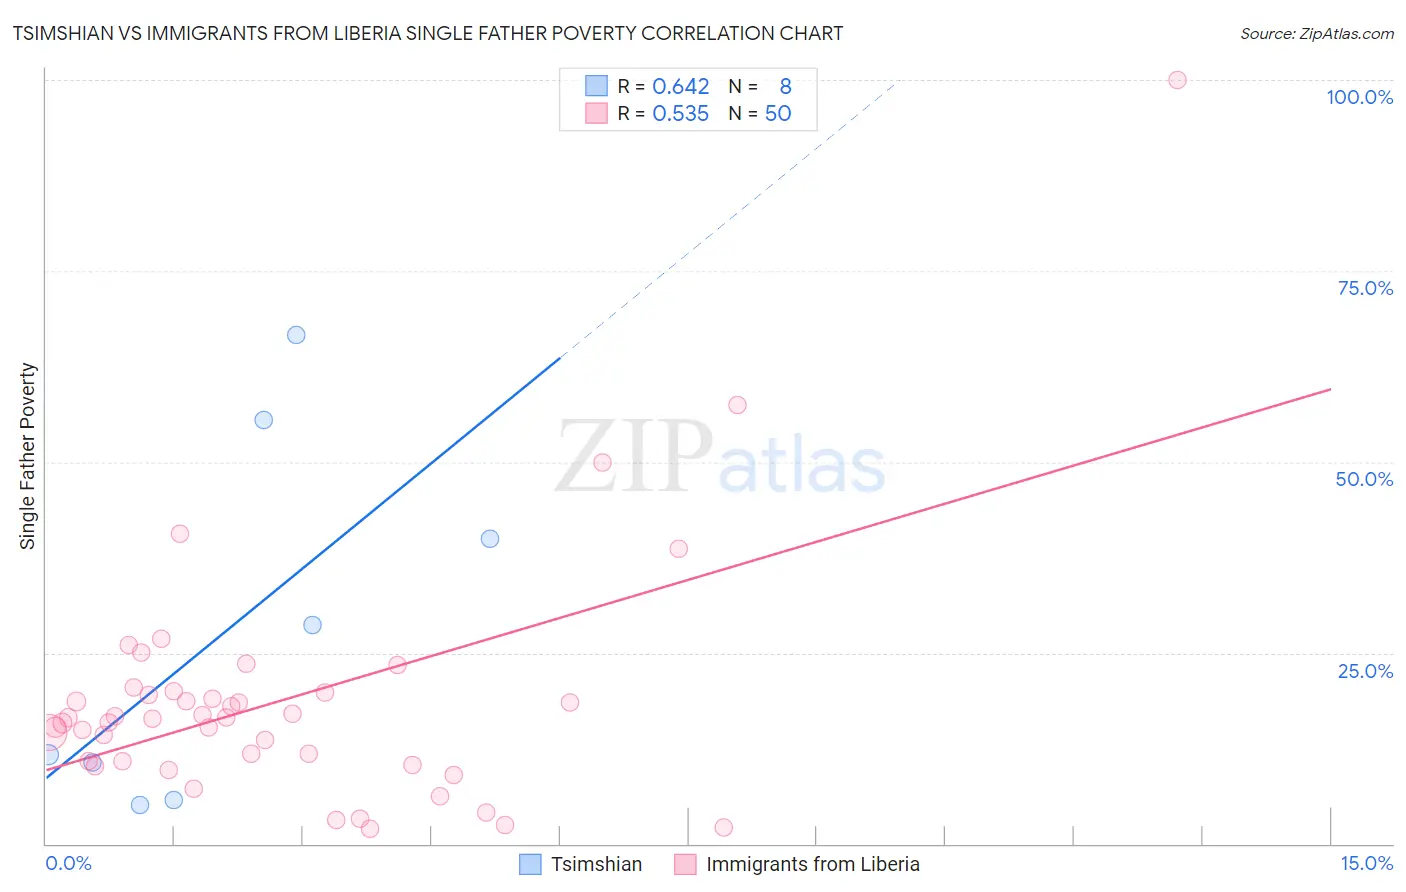
Tsimshian vs Immigrants from Liberia Single Father Poverty Correlation Chart
The statistical analysis conducted on geographies consisting of 14,553,815 people shows a significant positive correlation between the proportion of Tsimshian and poverty level among single fathers in the United States with a correlation coefficient (R) of 0.642 and weighted average of 12.7%. Similarly, the statistical analysis conducted on geographies consisting of 122,784,105 people shows a substantial positive correlation between the proportion of Immigrants from Liberia and poverty level among single fathers in the United States with a correlation coefficient (R) of 0.535 and weighted average of 15.9%, a difference of 25.1%.
Single Father Poverty Correlation Summary
| Measurement | Tsimshian | Immigrants from Liberia |
| Minimum | 5.1% | 2.0% |
| Maximum | 66.7% | 100.0% |
| Range | 61.5% | 98.0% |
| Mean | 28.0% | 18.7% |
| Median | 20.1% | 16.5% |
| Interquartile 25% (IQ1) | 8.1% | 10.8% |
| Interquartile 75% (IQ3) | 47.7% | 19.8% |
| Interquartile Range (IQR) | 39.6% | 9.0% |
| Standard Deviation (Sample) | 23.9% | 16.1% |
| Standard Deviation (Population) | 22.3% | 15.9% |
Similar Demographics by Single Father Poverty
Demographics Similar to Tsimshian by Single Father Poverty
In terms of single father poverty, the demographic groups most similar to Tsimshian are Tongan (12.2%, a difference of 3.9%), Immigrants from Fiji (13.2%, a difference of 4.2%), Immigrants from Ethiopia (13.4%, a difference of 5.9%), Ethiopian (13.5%, a difference of 6.7%), and Immigrants from Taiwan (13.7%, a difference of 7.8%).
| Demographics | Rating | Rank | Single Father Poverty |
| Assyrians/Chaldeans/Syriacs | 100.0 /100 | #1 | Exceptional 11.7% |
| Tongans | 100.0 /100 | #2 | Exceptional 12.2% |
| Tsimshian | 100.0 /100 | #3 | Exceptional 12.7% |
| Immigrants | Fiji | 100.0 /100 | #4 | Exceptional 13.2% |
| Immigrants | Ethiopia | 100.0 /100 | #5 | Exceptional 13.4% |
| Ethiopians | 100.0 /100 | #6 | Exceptional 13.5% |
| Immigrants | Taiwan | 100.0 /100 | #7 | Exceptional 13.7% |
| Samoans | 100.0 /100 | #8 | Exceptional 13.8% |
| Afghans | 100.0 /100 | #9 | Exceptional 14.0% |
| Koreans | 100.0 /100 | #10 | Exceptional 14.0% |
| Filipinos | 100.0 /100 | #11 | Exceptional 14.0% |
| Immigrants | India | 100.0 /100 | #12 | Exceptional 14.0% |
| Immigrants | Philippines | 100.0 /100 | #13 | Exceptional 14.0% |
| Immigrants | Vietnam | 100.0 /100 | #14 | Exceptional 14.1% |
| Sri Lankans | 100.0 /100 | #15 | Exceptional 14.2% |
Demographics Similar to Immigrants from Liberia by Single Father Poverty
In terms of single father poverty, the demographic groups most similar to Immigrants from Liberia are Hmong (15.9%, a difference of 0.010%), Iraqi (15.9%, a difference of 0.020%), Immigrants from Panama (15.9%, a difference of 0.030%), Immigrants from Nigeria (15.9%, a difference of 0.030%), and Palestinian (15.9%, a difference of 0.040%).
| Demographics | Rating | Rank | Single Father Poverty |
| Uruguayans | 92.1 /100 | #120 | Exceptional 15.9% |
| Immigrants | Immigrants | 91.9 /100 | #121 | Exceptional 15.9% |
| Sudanese | 91.6 /100 | #122 | Exceptional 15.9% |
| Palestinians | 91.3 /100 | #123 | Exceptional 15.9% |
| Immigrants | Panama | 91.3 /100 | #124 | Exceptional 15.9% |
| Iraqis | 91.2 /100 | #125 | Exceptional 15.9% |
| Hmong | 91.1 /100 | #126 | Exceptional 15.9% |
| Immigrants | Liberia | 91.1 /100 | #127 | Exceptional 15.9% |
| Immigrants | Nigeria | 90.8 /100 | #128 | Exceptional 15.9% |
| Immigrants | West Indies | 90.8 /100 | #129 | Exceptional 15.9% |
| Norwegians | 90.2 /100 | #130 | Exceptional 15.9% |
| Nicaraguans | 90.1 /100 | #131 | Exceptional 15.9% |
| Immigrants | Portugal | 89.7 /100 | #132 | Excellent 15.9% |
| Immigrants | Syria | 89.5 /100 | #133 | Excellent 15.9% |
| Immigrants | South America | 88.5 /100 | #134 | Excellent 15.9% |