Tsimshian vs Immigrants from Kazakhstan Single Father Poverty
COMPARE
Tsimshian
Immigrants from Kazakhstan
Single Father Poverty
Single Father Poverty Comparison
Tsimshian
Immigrants from Kazakhstan
12.7%
SINGLE FATHER POVERTY
100.0/ 100
METRIC RATING
3rd/ 347
METRIC RANK
15.6%
SINGLE FATHER POVERTY
98.2/ 100
METRIC RATING
95th/ 347
METRIC RANK
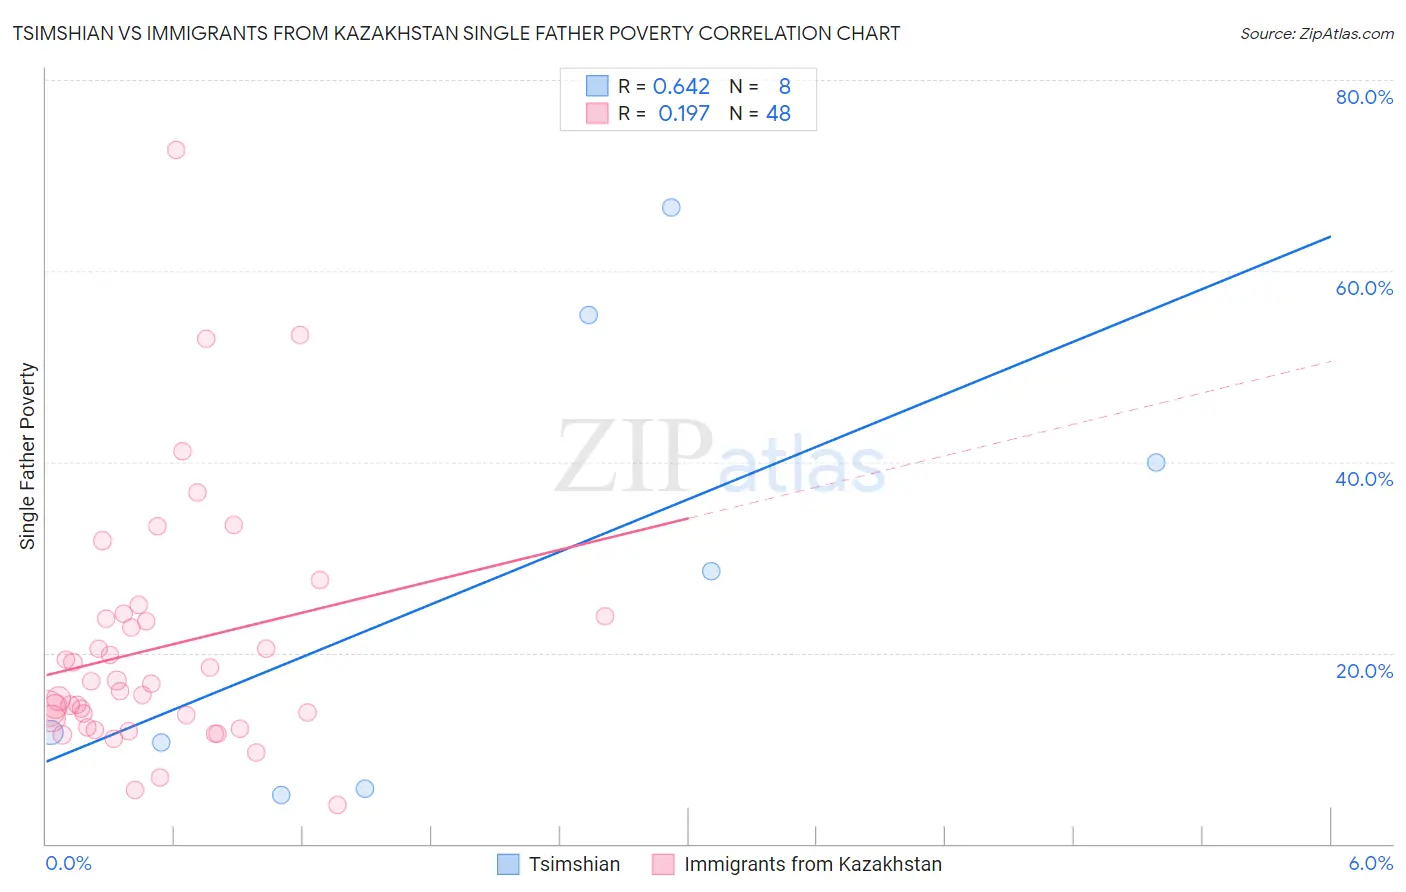
Tsimshian vs Immigrants from Kazakhstan Single Father Poverty Correlation Chart
The statistical analysis conducted on geographies consisting of 14,553,815 people shows a significant positive correlation between the proportion of Tsimshian and poverty level among single fathers in the United States with a correlation coefficient (R) of 0.642 and weighted average of 12.7%. Similarly, the statistical analysis conducted on geographies consisting of 108,344,450 people shows a poor positive correlation between the proportion of Immigrants from Kazakhstan and poverty level among single fathers in the United States with a correlation coefficient (R) of 0.197 and weighted average of 15.6%, a difference of 22.7%.
Single Father Poverty Correlation Summary
| Measurement | Tsimshian | Immigrants from Kazakhstan |
| Minimum | 5.1% | 4.0% |
| Maximum | 66.7% | 72.7% |
| Range | 61.5% | 68.7% |
| Mean | 28.0% | 20.5% |
| Median | 20.1% | 16.4% |
| Interquartile 25% (IQ1) | 8.1% | 12.7% |
| Interquartile 75% (IQ3) | 47.7% | 23.7% |
| Interquartile Range (IQR) | 39.6% | 11.0% |
| Standard Deviation (Sample) | 23.9% | 13.1% |
| Standard Deviation (Population) | 22.3% | 12.9% |
Similar Demographics by Single Father Poverty
Demographics Similar to Tsimshian by Single Father Poverty
In terms of single father poverty, the demographic groups most similar to Tsimshian are Tongan (12.2%, a difference of 3.9%), Immigrants from Fiji (13.2%, a difference of 4.2%), Immigrants from Ethiopia (13.4%, a difference of 5.9%), Ethiopian (13.5%, a difference of 6.7%), and Immigrants from Taiwan (13.7%, a difference of 7.8%).
| Demographics | Rating | Rank | Single Father Poverty |
| Assyrians/Chaldeans/Syriacs | 100.0 /100 | #1 | Exceptional 11.7% |
| Tongans | 100.0 /100 | #2 | Exceptional 12.2% |
| Tsimshian | 100.0 /100 | #3 | Exceptional 12.7% |
| Immigrants | Fiji | 100.0 /100 | #4 | Exceptional 13.2% |
| Immigrants | Ethiopia | 100.0 /100 | #5 | Exceptional 13.4% |
| Ethiopians | 100.0 /100 | #6 | Exceptional 13.5% |
| Immigrants | Taiwan | 100.0 /100 | #7 | Exceptional 13.7% |
| Samoans | 100.0 /100 | #8 | Exceptional 13.8% |
| Afghans | 100.0 /100 | #9 | Exceptional 14.0% |
| Koreans | 100.0 /100 | #10 | Exceptional 14.0% |
| Filipinos | 100.0 /100 | #11 | Exceptional 14.0% |
| Immigrants | India | 100.0 /100 | #12 | Exceptional 14.0% |
| Immigrants | Philippines | 100.0 /100 | #13 | Exceptional 14.0% |
| Immigrants | Vietnam | 100.0 /100 | #14 | Exceptional 14.1% |
| Sri Lankans | 100.0 /100 | #15 | Exceptional 14.2% |
Demographics Similar to Immigrants from Kazakhstan by Single Father Poverty
In terms of single father poverty, the demographic groups most similar to Immigrants from Kazakhstan are Immigrants from Belgium (15.6%, a difference of 0.010%), Yaqui (15.6%, a difference of 0.020%), Zimbabwean (15.6%, a difference of 0.030%), Immigrants from Uruguay (15.6%, a difference of 0.050%), and Basque (15.5%, a difference of 0.19%).
| Demographics | Rating | Rank | Single Father Poverty |
| Burmese | 99.0 /100 | #88 | Exceptional 15.5% |
| Immigrants | Korea | 99.0 /100 | #89 | Exceptional 15.5% |
| Mexican American Indians | 98.7 /100 | #90 | Exceptional 15.5% |
| Immigrants | Romania | 98.6 /100 | #91 | Exceptional 15.5% |
| Immigrants | Serbia | 98.5 /100 | #92 | Exceptional 15.5% |
| Basques | 98.4 /100 | #93 | Exceptional 15.5% |
| Immigrants | Uruguay | 98.2 /100 | #94 | Exceptional 15.6% |
| Immigrants | Kazakhstan | 98.2 /100 | #95 | Exceptional 15.6% |
| Immigrants | Belgium | 98.1 /100 | #96 | Exceptional 15.6% |
| Yaqui | 98.1 /100 | #97 | Exceptional 15.6% |
| Zimbabweans | 98.1 /100 | #98 | Exceptional 15.6% |
| Immigrants | Middle Africa | 97.4 /100 | #99 | Exceptional 15.6% |
| Immigrants | Chile | 96.9 /100 | #100 | Exceptional 15.7% |
| Fijians | 96.8 /100 | #101 | Exceptional 15.7% |
| Chileans | 96.4 /100 | #102 | Exceptional 15.7% |