Belgian vs Immigrants from Ireland Single Father Poverty
COMPARE
Belgian
Immigrants from Ireland
Single Father Poverty
Single Father Poverty Comparison
Belgians
Immigrants from Ireland
16.8%
SINGLE FATHER POVERTY
5.3/ 100
METRIC RATING
228th/ 347
METRIC RANK
17.1%
SINGLE FATHER POVERTY
1.4/ 100
METRIC RATING
246th/ 347
METRIC RANK
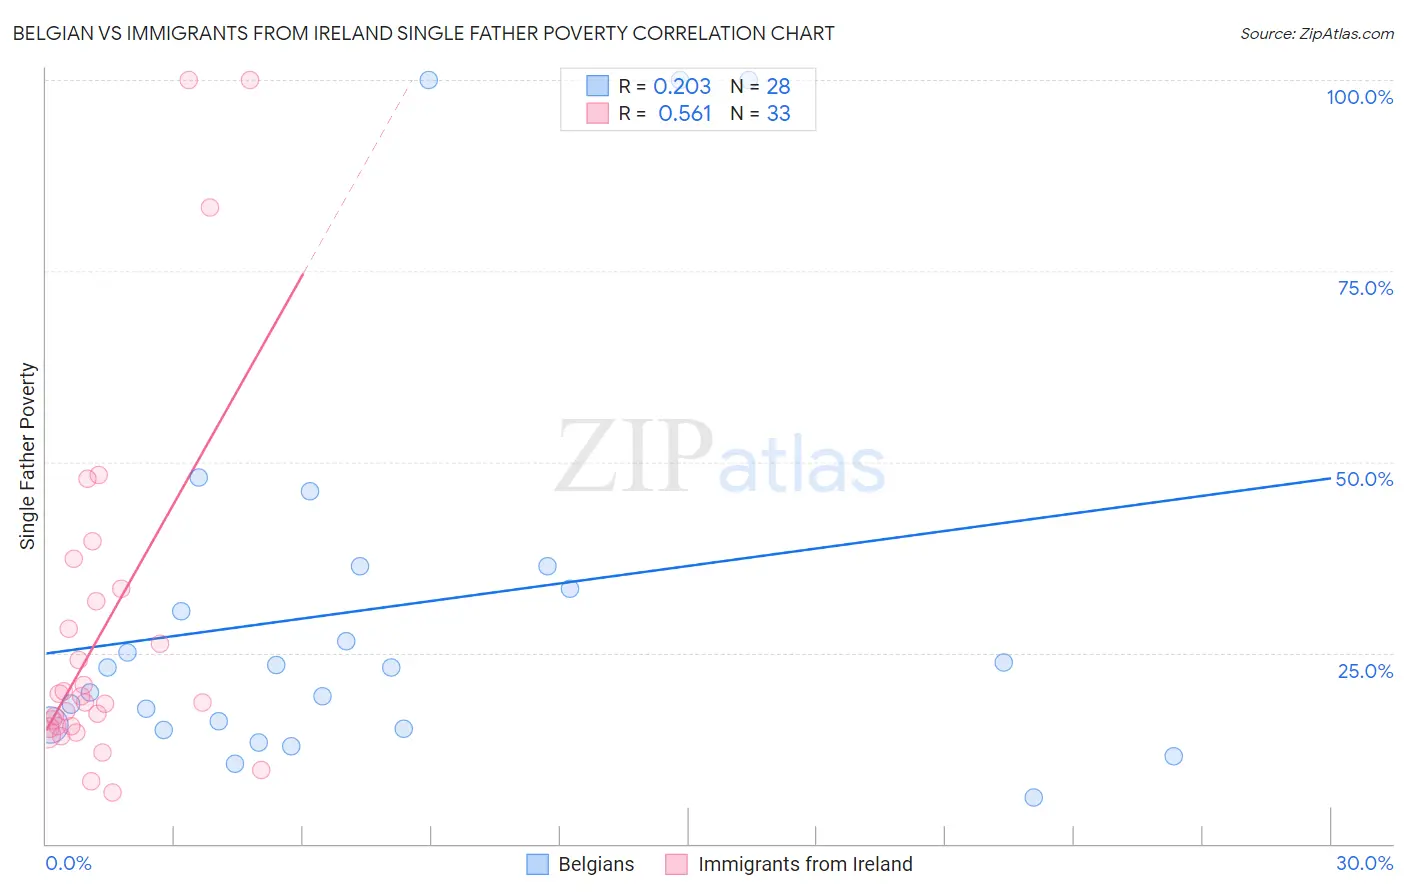
Belgian vs Immigrants from Ireland Single Father Poverty Correlation Chart
The statistical analysis conducted on geographies consisting of 276,929,411 people shows a weak positive correlation between the proportion of Belgians and poverty level among single fathers in the United States with a correlation coefficient (R) of 0.203 and weighted average of 16.8%. Similarly, the statistical analysis conducted on geographies consisting of 193,149,664 people shows a substantial positive correlation between the proportion of Immigrants from Ireland and poverty level among single fathers in the United States with a correlation coefficient (R) of 0.561 and weighted average of 17.1%, a difference of 1.4%.
Single Father Poverty Correlation Summary
| Measurement | Belgian | Immigrants from Ireland |
| Minimum | 6.1% | 6.7% |
| Maximum | 100.0% | 100.0% |
| Range | 93.9% | 93.3% |
| Mean | 30.9% | 28.1% |
| Median | 23.0% | 18.5% |
| Interquartile 25% (IQ1) | 15.3% | 15.3% |
| Interquartile 75% (IQ3) | 34.8% | 32.6% |
| Interquartile Range (IQR) | 19.6% | 17.3% |
| Standard Deviation (Sample) | 26.4% | 23.7% |
| Standard Deviation (Population) | 25.9% | 23.4% |
Demographics Similar to Belgians and Immigrants from Ireland by Single Father Poverty
In terms of single father poverty, the demographic groups most similar to Belgians are British (16.8%, a difference of 0.070%), Israeli (16.8%, a difference of 0.16%), Immigrants from Trinidad and Tobago (16.8%, a difference of 0.19%), Spanish American (16.9%, a difference of 0.40%), and Immigrants from Grenada (16.9%, a difference of 0.42%). Similarly, the demographic groups most similar to Immigrants from Ireland are Trinidadian and Tobagonian (17.0%, a difference of 0.040%), Honduran (17.0%, a difference of 0.080%), Immigrants from Cabo Verde (17.0%, a difference of 0.10%), Greek (17.1%, a difference of 0.10%), and Moroccan (17.0%, a difference of 0.42%).
| Demographics | Rating | Rank | Single Father Poverty |
| British | 5.6 /100 | #227 | Tragic 16.8% |
| Belgians | 5.3 /100 | #228 | Tragic 16.8% |
| Israelis | 4.6 /100 | #229 | Tragic 16.8% |
| Immigrants | Trinidad and Tobago | 4.5 /100 | #230 | Tragic 16.8% |
| Spanish Americans | 3.7 /100 | #231 | Tragic 16.9% |
| Immigrants | Grenada | 3.7 /100 | #232 | Tragic 16.9% |
| Senegalese | 3.2 /100 | #233 | Tragic 16.9% |
| Marshallese | 3.1 /100 | #234 | Tragic 16.9% |
| Immigrants | Western Europe | 2.9 /100 | #235 | Tragic 16.9% |
| Immigrants | Germany | 2.9 /100 | #236 | Tragic 16.9% |
| Sub-Saharan Africans | 2.9 /100 | #237 | Tragic 16.9% |
| Immigrants | Saudi Arabia | 2.7 /100 | #238 | Tragic 16.9% |
| Bermudans | 2.6 /100 | #239 | Tragic 16.9% |
| Finns | 2.6 /100 | #240 | Tragic 16.9% |
| Czechs | 2.3 /100 | #241 | Tragic 17.0% |
| Moroccans | 2.1 /100 | #242 | Tragic 17.0% |
| Immigrants | Cabo Verde | 1.6 /100 | #243 | Tragic 17.0% |
| Hondurans | 1.6 /100 | #244 | Tragic 17.0% |
| Trinidadians and Tobagonians | 1.5 /100 | #245 | Tragic 17.0% |
| Immigrants | Ireland | 1.4 /100 | #246 | Tragic 17.1% |
| Greeks | 1.3 /100 | #247 | Tragic 17.1% |