Tsimshian vs Immigrants from Sweden Single Father Poverty
COMPARE
Tsimshian
Immigrants from Sweden
Single Father Poverty
Single Father Poverty Comparison
Tsimshian
Immigrants from Sweden
12.7%
SINGLE FATHER POVERTY
100.0/ 100
METRIC RATING
3rd/ 347
METRIC RANK
15.2%
SINGLE FATHER POVERTY
99.8/ 100
METRIC RATING
63rd/ 347
METRIC RANK
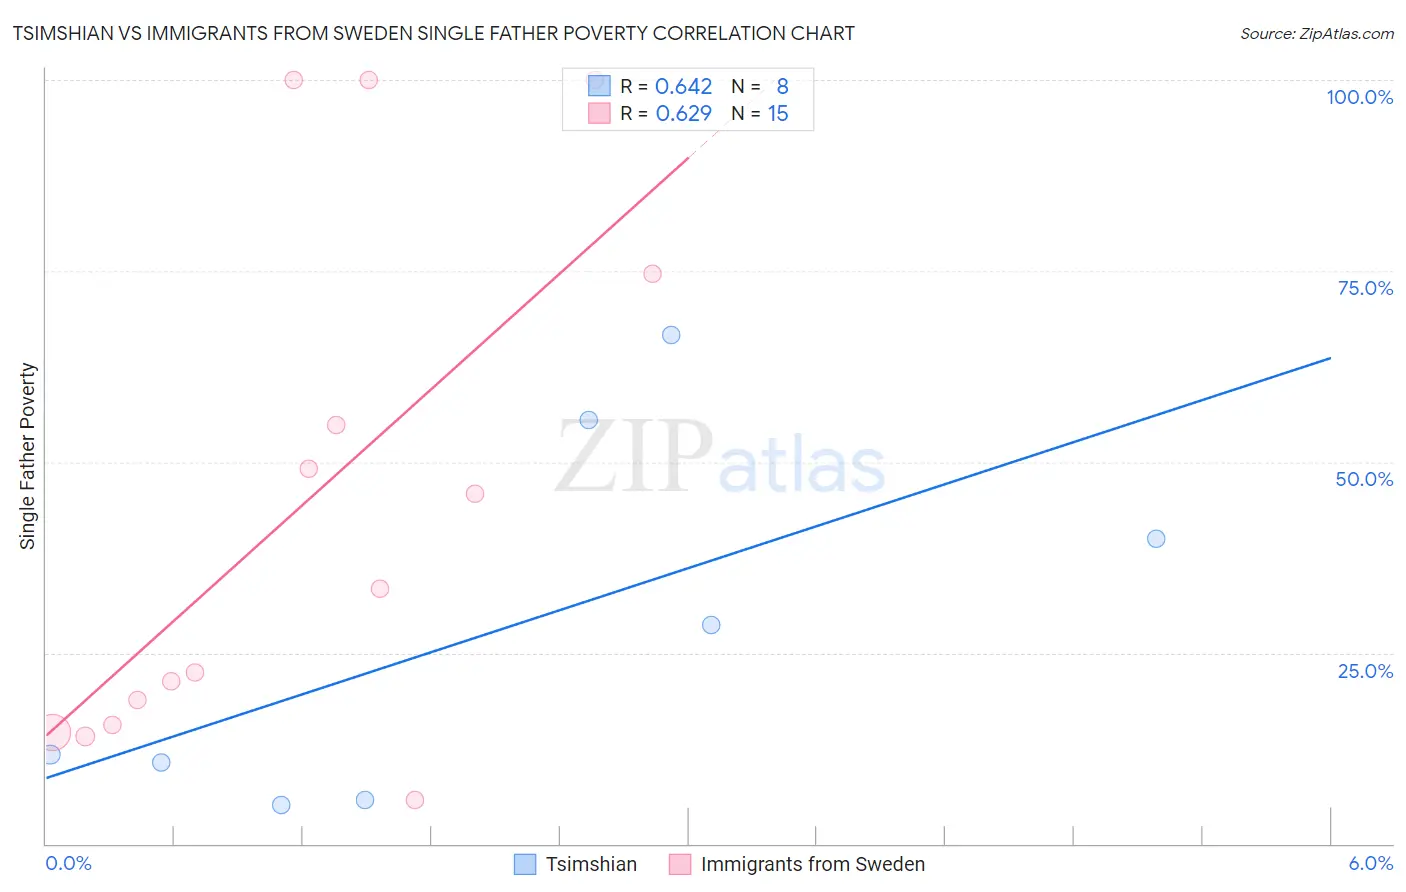
Tsimshian vs Immigrants from Sweden Single Father Poverty Correlation Chart
The statistical analysis conducted on geographies consisting of 14,553,815 people shows a significant positive correlation between the proportion of Tsimshian and poverty level among single fathers in the United States with a correlation coefficient (R) of 0.642 and weighted average of 12.7%. Similarly, the statistical analysis conducted on geographies consisting of 139,123,706 people shows a significant positive correlation between the proportion of Immigrants from Sweden and poverty level among single fathers in the United States with a correlation coefficient (R) of 0.629 and weighted average of 15.2%, a difference of 19.5%.
Single Father Poverty Correlation Summary
| Measurement | Tsimshian | Immigrants from Sweden |
| Minimum | 5.1% | 5.8% |
| Maximum | 66.7% | 100.0% |
| Range | 61.5% | 94.2% |
| Mean | 28.0% | 44.7% |
| Median | 20.1% | 33.3% |
| Interquartile 25% (IQ1) | 8.1% | 15.5% |
| Interquartile 75% (IQ3) | 47.7% | 74.7% |
| Interquartile Range (IQR) | 39.6% | 59.2% |
| Standard Deviation (Sample) | 23.9% | 34.1% |
| Standard Deviation (Population) | 22.3% | 32.9% |
Similar Demographics by Single Father Poverty
Demographics Similar to Tsimshian by Single Father Poverty
In terms of single father poverty, the demographic groups most similar to Tsimshian are Tongan (12.2%, a difference of 3.9%), Immigrants from Fiji (13.2%, a difference of 4.2%), Immigrants from Ethiopia (13.4%, a difference of 5.9%), Ethiopian (13.5%, a difference of 6.7%), and Immigrants from Taiwan (13.7%, a difference of 7.8%).
| Demographics | Rating | Rank | Single Father Poverty |
| Assyrians/Chaldeans/Syriacs | 100.0 /100 | #1 | Exceptional 11.7% |
| Tongans | 100.0 /100 | #2 | Exceptional 12.2% |
| Tsimshian | 100.0 /100 | #3 | Exceptional 12.7% |
| Immigrants | Fiji | 100.0 /100 | #4 | Exceptional 13.2% |
| Immigrants | Ethiopia | 100.0 /100 | #5 | Exceptional 13.4% |
| Ethiopians | 100.0 /100 | #6 | Exceptional 13.5% |
| Immigrants | Taiwan | 100.0 /100 | #7 | Exceptional 13.7% |
| Samoans | 100.0 /100 | #8 | Exceptional 13.8% |
| Afghans | 100.0 /100 | #9 | Exceptional 14.0% |
| Koreans | 100.0 /100 | #10 | Exceptional 14.0% |
| Filipinos | 100.0 /100 | #11 | Exceptional 14.0% |
| Immigrants | India | 100.0 /100 | #12 | Exceptional 14.0% |
| Immigrants | Philippines | 100.0 /100 | #13 | Exceptional 14.0% |
| Immigrants | Vietnam | 100.0 /100 | #14 | Exceptional 14.1% |
| Sri Lankans | 100.0 /100 | #15 | Exceptional 14.2% |
Demographics Similar to Immigrants from Sweden by Single Father Poverty
In terms of single father poverty, the demographic groups most similar to Immigrants from Sweden are Bangladeshi (15.2%, a difference of 0.080%), Immigrants from Armenia (15.2%, a difference of 0.090%), Immigrants from Bosnia and Herzegovina (15.2%, a difference of 0.10%), Puget Sound Salish (15.2%, a difference of 0.14%), and Immigrants from Malaysia (15.2%, a difference of 0.16%).
| Demographics | Rating | Rank | Single Father Poverty |
| Immigrants | Laos | 99.9 /100 | #56 | Exceptional 15.1% |
| Laotians | 99.9 /100 | #57 | Exceptional 15.1% |
| Hawaiians | 99.9 /100 | #58 | Exceptional 15.1% |
| Guamanians/Chamorros | 99.9 /100 | #59 | Exceptional 15.1% |
| Puget Sound Salish | 99.8 /100 | #60 | Exceptional 15.2% |
| Immigrants | Bosnia and Herzegovina | 99.8 /100 | #61 | Exceptional 15.2% |
| Immigrants | Armenia | 99.8 /100 | #62 | Exceptional 15.2% |
| Immigrants | Sweden | 99.8 /100 | #63 | Exceptional 15.2% |
| Bangladeshis | 99.8 /100 | #64 | Exceptional 15.2% |
| Immigrants | Malaysia | 99.8 /100 | #65 | Exceptional 15.2% |
| Immigrants | Moldova | 99.8 /100 | #66 | Exceptional 15.2% |
| Paraguayans | 99.7 /100 | #67 | Exceptional 15.2% |
| Immigrants | Cameroon | 99.7 /100 | #68 | Exceptional 15.2% |
| Japanese | 99.7 /100 | #69 | Exceptional 15.2% |
| Mongolians | 99.7 /100 | #70 | Exceptional 15.3% |