Tsimshian vs Mexican American Indian Single Father Poverty
COMPARE
Tsimshian
Mexican American Indian
Single Father Poverty
Single Father Poverty Comparison
Tsimshian
Mexican American Indians
12.7%
SINGLE FATHER POVERTY
100.0/ 100
METRIC RATING
3rd/ 347
METRIC RANK
15.5%
SINGLE FATHER POVERTY
98.7/ 100
METRIC RATING
90th/ 347
METRIC RANK
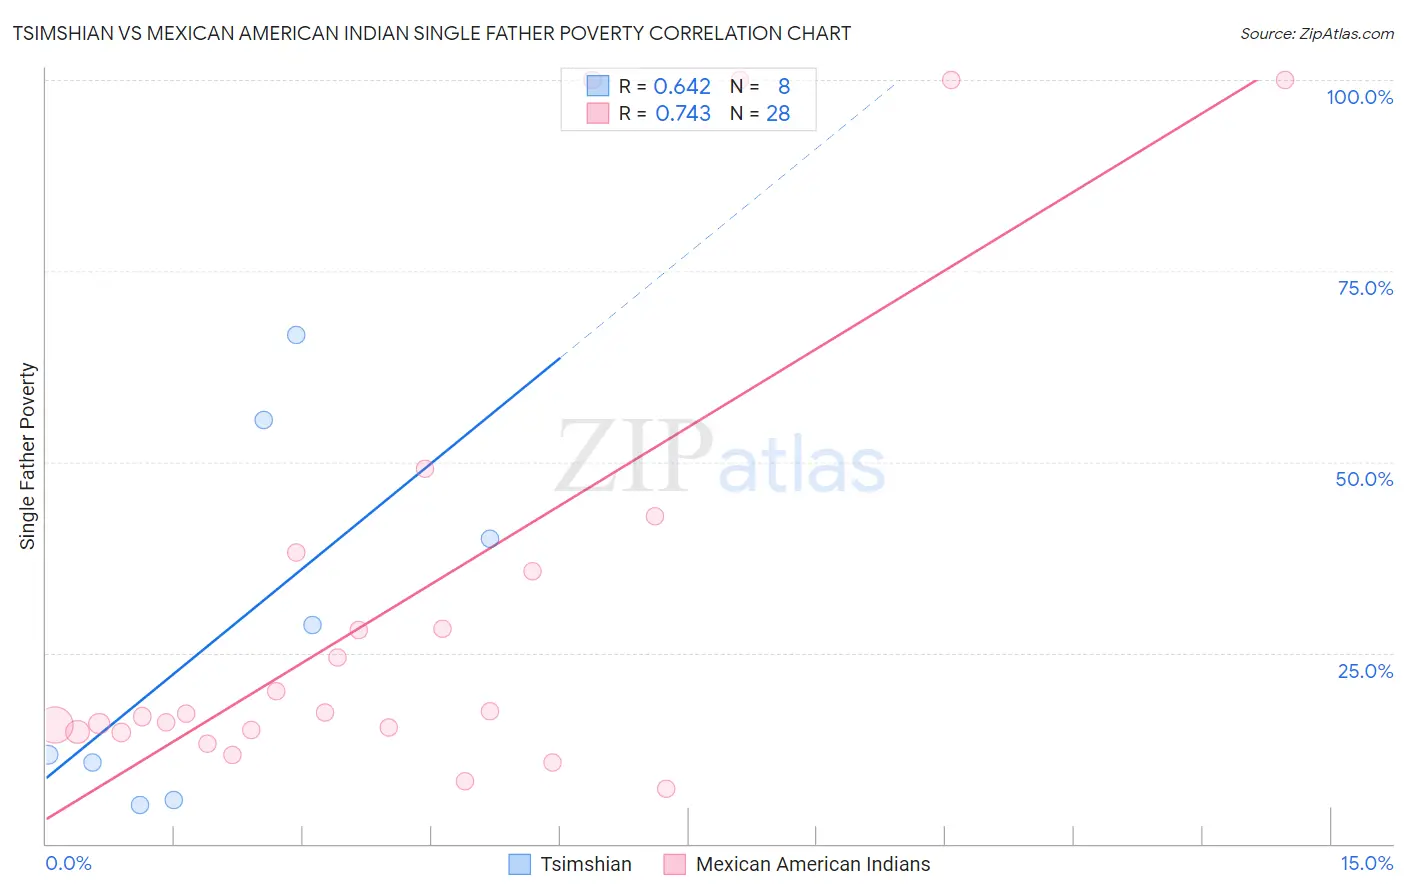
Tsimshian vs Mexican American Indian Single Father Poverty Correlation Chart
The statistical analysis conducted on geographies consisting of 14,553,815 people shows a significant positive correlation between the proportion of Tsimshian and poverty level among single fathers in the United States with a correlation coefficient (R) of 0.642 and weighted average of 12.7%. Similarly, the statistical analysis conducted on geographies consisting of 266,902,883 people shows a strong positive correlation between the proportion of Mexican American Indians and poverty level among single fathers in the United States with a correlation coefficient (R) of 0.743 and weighted average of 15.5%, a difference of 22.2%.
Single Father Poverty Correlation Summary
| Measurement | Tsimshian | Mexican American Indian |
| Minimum | 5.1% | 7.3% |
| Maximum | 66.7% | 100.0% |
| Range | 61.5% | 92.7% |
| Mean | 28.0% | 31.8% |
| Median | 20.1% | 17.1% |
| Interquartile 25% (IQ1) | 8.1% | 14.8% |
| Interquartile 75% (IQ3) | 47.7% | 36.9% |
| Interquartile Range (IQR) | 39.6% | 22.1% |
| Standard Deviation (Sample) | 23.9% | 30.1% |
| Standard Deviation (Population) | 22.3% | 29.6% |
Similar Demographics by Single Father Poverty
Demographics Similar to Tsimshian by Single Father Poverty
In terms of single father poverty, the demographic groups most similar to Tsimshian are Tongan (12.2%, a difference of 3.9%), Immigrants from Fiji (13.2%, a difference of 4.2%), Immigrants from Ethiopia (13.4%, a difference of 5.9%), Ethiopian (13.5%, a difference of 6.7%), and Immigrants from Taiwan (13.7%, a difference of 7.8%).
| Demographics | Rating | Rank | Single Father Poverty |
| Assyrians/Chaldeans/Syriacs | 100.0 /100 | #1 | Exceptional 11.7% |
| Tongans | 100.0 /100 | #2 | Exceptional 12.2% |
| Tsimshian | 100.0 /100 | #3 | Exceptional 12.7% |
| Immigrants | Fiji | 100.0 /100 | #4 | Exceptional 13.2% |
| Immigrants | Ethiopia | 100.0 /100 | #5 | Exceptional 13.4% |
| Ethiopians | 100.0 /100 | #6 | Exceptional 13.5% |
| Immigrants | Taiwan | 100.0 /100 | #7 | Exceptional 13.7% |
| Samoans | 100.0 /100 | #8 | Exceptional 13.8% |
| Afghans | 100.0 /100 | #9 | Exceptional 14.0% |
| Koreans | 100.0 /100 | #10 | Exceptional 14.0% |
| Filipinos | 100.0 /100 | #11 | Exceptional 14.0% |
| Immigrants | India | 100.0 /100 | #12 | Exceptional 14.0% |
| Immigrants | Philippines | 100.0 /100 | #13 | Exceptional 14.0% |
| Immigrants | Vietnam | 100.0 /100 | #14 | Exceptional 14.1% |
| Sri Lankans | 100.0 /100 | #15 | Exceptional 14.2% |
Demographics Similar to Mexican American Indians by Single Father Poverty
In terms of single father poverty, the demographic groups most similar to Mexican American Indians are Immigrants from Romania (15.5%, a difference of 0.10%), Immigrants from Serbia (15.5%, a difference of 0.21%), Immigrants from Korea (15.5%, a difference of 0.23%), Basque (15.5%, a difference of 0.25%), and Burmese (15.5%, a difference of 0.29%).
| Demographics | Rating | Rank | Single Father Poverty |
| Chinese | 99.3 /100 | #83 | Exceptional 15.4% |
| Peruvians | 99.2 /100 | #84 | Exceptional 15.4% |
| Immigrants | Oceania | 99.1 /100 | #85 | Exceptional 15.4% |
| Immigrants | Russia | 99.0 /100 | #86 | Exceptional 15.5% |
| Brazilians | 99.0 /100 | #87 | Exceptional 15.5% |
| Burmese | 99.0 /100 | #88 | Exceptional 15.5% |
| Immigrants | Korea | 99.0 /100 | #89 | Exceptional 15.5% |
| Mexican American Indians | 98.7 /100 | #90 | Exceptional 15.5% |
| Immigrants | Romania | 98.6 /100 | #91 | Exceptional 15.5% |
| Immigrants | Serbia | 98.5 /100 | #92 | Exceptional 15.5% |
| Basques | 98.4 /100 | #93 | Exceptional 15.5% |
| Immigrants | Uruguay | 98.2 /100 | #94 | Exceptional 15.6% |
| Immigrants | Kazakhstan | 98.2 /100 | #95 | Exceptional 15.6% |
| Immigrants | Belgium | 98.1 /100 | #96 | Exceptional 15.6% |
| Yaqui | 98.1 /100 | #97 | Exceptional 15.6% |