Chippewa vs Immigrants from Ireland Single Father Poverty
COMPARE
Chippewa
Immigrants from Ireland
Single Father Poverty
Single Father Poverty Comparison
Chippewa
Immigrants from Ireland
18.8%
SINGLE FATHER POVERTY
0.0/ 100
METRIC RATING
310th/ 347
METRIC RANK
17.1%
SINGLE FATHER POVERTY
1.4/ 100
METRIC RATING
246th/ 347
METRIC RANK
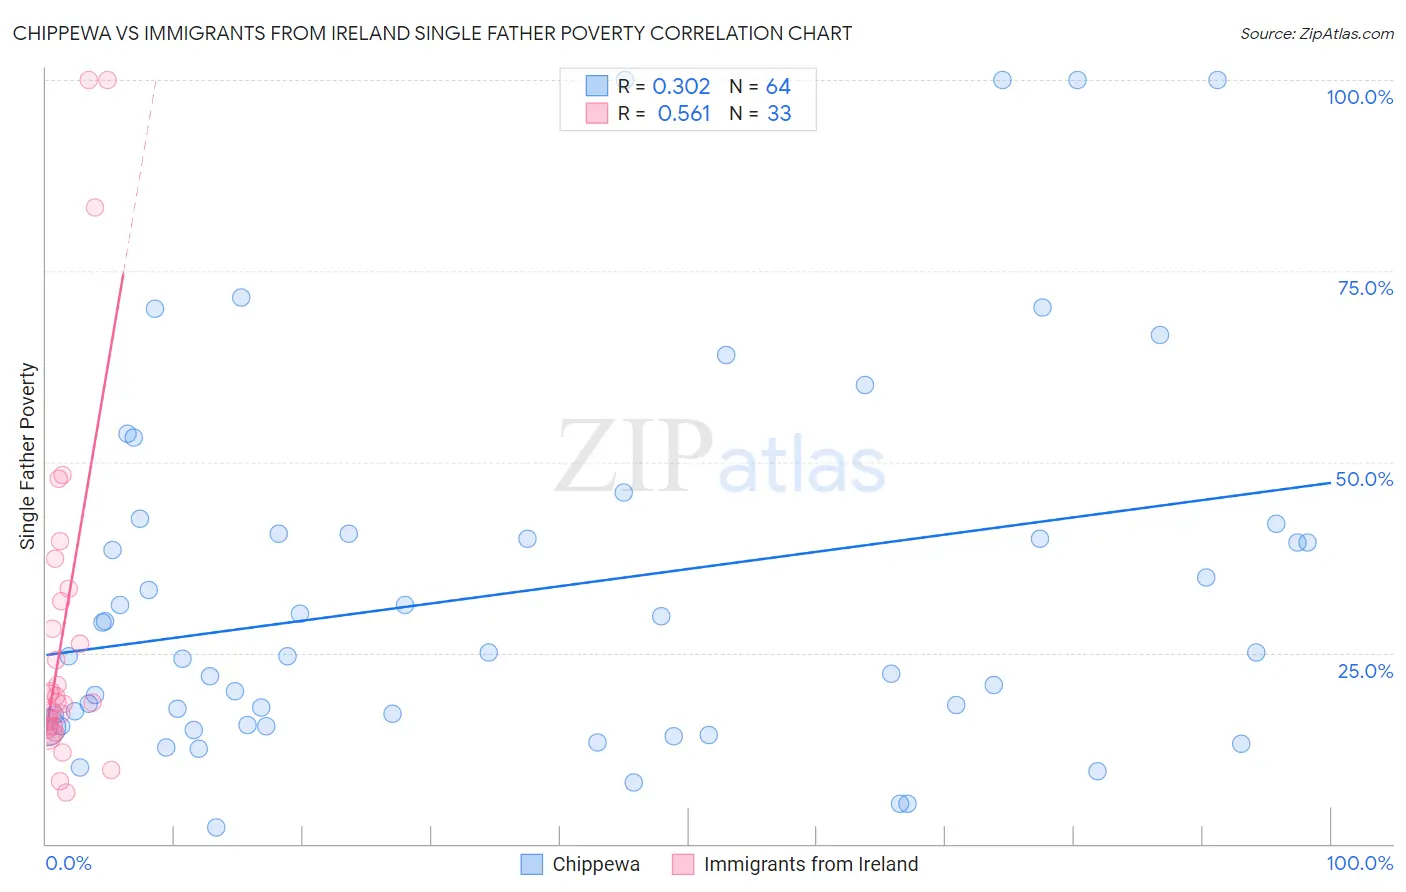
Chippewa vs Immigrants from Ireland Single Father Poverty Correlation Chart
The statistical analysis conducted on geographies consisting of 183,159,389 people shows a mild positive correlation between the proportion of Chippewa and poverty level among single fathers in the United States with a correlation coefficient (R) of 0.302 and weighted average of 18.8%. Similarly, the statistical analysis conducted on geographies consisting of 193,149,664 people shows a substantial positive correlation between the proportion of Immigrants from Ireland and poverty level among single fathers in the United States with a correlation coefficient (R) of 0.561 and weighted average of 17.1%, a difference of 10.3%.
Single Father Poverty Correlation Summary
| Measurement | Chippewa | Immigrants from Ireland |
| Minimum | 2.1% | 6.7% |
| Maximum | 100.0% | 100.0% |
| Range | 97.9% | 93.3% |
| Mean | 33.0% | 28.1% |
| Median | 24.8% | 18.5% |
| Interquartile 25% (IQ1) | 15.5% | 15.3% |
| Interquartile 75% (IQ3) | 40.6% | 32.6% |
| Interquartile Range (IQR) | 25.1% | 17.3% |
| Standard Deviation (Sample) | 24.4% | 23.7% |
| Standard Deviation (Population) | 24.2% | 23.4% |
Similar Demographics by Single Father Poverty
Demographics Similar to Chippewa by Single Father Poverty
In terms of single father poverty, the demographic groups most similar to Chippewa are Nonimmigrants (18.8%, a difference of 0.19%), Immigrants from Dominica (18.9%, a difference of 0.24%), Potawatomi (18.9%, a difference of 0.44%), Delaware (18.9%, a difference of 0.61%), and Chickasaw (19.0%, a difference of 0.76%).
| Demographics | Rating | Rank | Single Father Poverty |
| Celtics | 0.0 /100 | #303 | Tragic 18.5% |
| Ute | 0.0 /100 | #304 | Tragic 18.5% |
| Blackfeet | 0.0 /100 | #305 | Tragic 18.5% |
| Scotch-Irish | 0.0 /100 | #306 | Tragic 18.6% |
| French Canadians | 0.0 /100 | #307 | Tragic 18.6% |
| Ottawa | 0.0 /100 | #308 | Tragic 18.6% |
| Immigrants | Micronesia | 0.0 /100 | #309 | Tragic 18.6% |
| Chippewa | 0.0 /100 | #310 | Tragic 18.8% |
| Immigrants | Nonimmigrants | 0.0 /100 | #311 | Tragic 18.8% |
| Immigrants | Dominica | 0.0 /100 | #312 | Tragic 18.9% |
| Potawatomi | 0.0 /100 | #313 | Tragic 18.9% |
| Delaware | 0.0 /100 | #314 | Tragic 18.9% |
| Chickasaw | 0.0 /100 | #315 | Tragic 19.0% |
| Osage | 0.0 /100 | #316 | Tragic 19.0% |
| Dominicans | 0.0 /100 | #317 | Tragic 19.1% |
Demographics Similar to Immigrants from Ireland by Single Father Poverty
In terms of single father poverty, the demographic groups most similar to Immigrants from Ireland are Trinidadian and Tobagonian (17.0%, a difference of 0.040%), Honduran (17.0%, a difference of 0.080%), Immigrants from Cabo Verde (17.0%, a difference of 0.10%), Greek (17.1%, a difference of 0.10%), and Czechoslovakian (17.1%, a difference of 0.10%).
| Demographics | Rating | Rank | Single Father Poverty |
| Bermudans | 2.6 /100 | #239 | Tragic 16.9% |
| Finns | 2.6 /100 | #240 | Tragic 16.9% |
| Czechs | 2.3 /100 | #241 | Tragic 17.0% |
| Moroccans | 2.1 /100 | #242 | Tragic 17.0% |
| Immigrants | Cabo Verde | 1.6 /100 | #243 | Tragic 17.0% |
| Hondurans | 1.6 /100 | #244 | Tragic 17.0% |
| Trinidadians and Tobagonians | 1.5 /100 | #245 | Tragic 17.0% |
| Immigrants | Ireland | 1.4 /100 | #246 | Tragic 17.1% |
| Greeks | 1.3 /100 | #247 | Tragic 17.1% |
| Czechoslovakians | 1.3 /100 | #248 | Tragic 17.1% |
| Canadians | 1.3 /100 | #249 | Tragic 17.1% |
| Austrians | 1.1 /100 | #250 | Tragic 17.1% |
| Luxembourgers | 1.1 /100 | #251 | Tragic 17.1% |
| Croatians | 1.0 /100 | #252 | Tragic 17.1% |
| Cree | 1.0 /100 | #253 | Tragic 17.1% |