Tsimshian vs Immigrants from Nepal Single Father Poverty

COMPARE

Tsimshian
Race
Ancestry
AfghanAfricanAlaska NativeAlaskan AthabascanAlbanianAleutAlsatianAmericanApacheArabArapahoArgentineanArmenianAssyrian/Chaldean/SyriacAustralianAustrianBahamianBangladeshiBarbadianBasqueBelgianBelizeanBermudanBhutaneseBlackfeetBolivianBrazilianBritishBritish West IndianBulgarianBurmeseCajunCambodianCanadianCape VerdeanCarpatho RusynCelticCentral AmericanCentral American IndianCherokeeCheyenneChickasawChileanChineseChippewaChoctawColombianColvilleComancheCosta RicanCreeCreekCroatianCrowCubanCypriotCzechCzechoslovakianDanishDelawareDominicanDutchDutch West IndianEastern EuropeanEcuadorianEgyptianEnglishEstonianEthiopianEuropeanFijianFilipinoFinnishFrenchFrench American IndianFrench CanadianGermanGerman RussianGhanaianGreekGuamanian/ChamorroGuatemalanGuyaneseHaitianHmongHonduranHopiHoumaHungarianIcelanderIndian (Asian)IndonesianInupiatIranianIraqiIrishIroquoisIsraeliItalianJamaicanJapaneseJordanianKenyanKiowaKoreanLaotianLatvianLebaneseLiberianLithuanianLumbeeLuxembourgerMacedonianMalaysianMalteseMarshalleseMenomineeMexicanMexican American IndianMongolianMoroccanNative HawaiianNavajoNepaleseNew ZealanderNicaraguanNigerianNorthern EuropeanNorwegianOkinawanOsageOttawaPaiutePakistaniPalestinianPanamanianParaguayanPennsylvania GermanPeruvianPimaPolishPortuguesePotawatomiPuebloPuerto RicanPuget Sound SalishRomanianRussianSalvadoranSamoanScandinavianScotch-IrishScottishSeminoleSenegaleseSerbianShoshoneSierra LeoneanSiouxSlavicSlovakSloveneSomaliSouth AfricanSouth AmericanSouth American IndianSoviet UnionSpaniardSpanishSpanish AmericanSpanish American IndianSri LankanSubsaharan AfricanSudaneseSwedishSwissSyrianTaiwaneseThaiTlingit-HaidaTohono O'OdhamTonganTrinidadian and TobagonianTsimshianTurkishU.S. Virgin IslanderUgandanUkrainianUruguayanUteVenezuelanVietnameseWelshWest IndianYakamaYaquiYugoslavianYumanYup'ikZimbabwean
Immigration
NonimmigrantsImmigrantsAfghanistanAfricaAlbaniaArgentinaArmeniaAsiaAustraliaAustriaBahamasBangladeshBarbadosBelarusBelgiumBelizeBoliviaBosnia and HerzegovinaBrazilBulgariaBurma/MyanmarCabo VerdeCambodiaCameroonCanadaCaribbeanCentral AmericaChileChinaColombiaCongoCosta RicaCroatiaCubaCzechoslovakiaDenmarkDominicaDominican RepublicEastern AfricaEastern AsiaEastern EuropeEcuadorEgyptEl SalvadorEnglandEritreaEthiopiaEuropeFijiFranceGermanyGhanaGreeceGrenadaGuatemalaGuyanaHaitiHondurasHong KongHungaryIndiaIndonesiaIranIraqIrelandIsraelItalyJamaicaJapanJordanKazakhstanKenyaKoreaKuwaitLaosLatin AmericaLatviaLebanonLiberiaLithuaniaMalaysiaMexicoMicronesiaMiddle AfricaMoldovaMoroccoNetherlandsNicaraguaNigeriaNorth AmericaNorth MacedoniaNorthern AfricaNorthern EuropeNorwayOceaniaPakistanPanamaPeruPhilippinesPolandPortugalRomaniaRussiaSaudi ArabiaScotlandSenegalSerbiaSierra LeoneSingaporeSomaliaSouth AfricaSouth AmericaSouth Central AsiaSouth Eastern AsiaSouthern EuropeSpainSri LankaSt. Vincent and the GrenadinesSudanSwedenSwitzerlandSyriaTaiwanThailandTrinidad and TobagoTurkeyUgandaUkraineUruguayUzbekistanVenezuelaVietnamWest IndiesWestern AfricaWestern AsiaWestern EuropeYemenZaireZimbabweAzores
Immigrants from Nepal
Race
Ancestry
AfghanAfricanAlaska NativeAlaskan AthabascanAlbanianAleutAlsatianAmericanApacheArabArapahoArgentineanArmenianAssyrian/Chaldean/SyriacAustralianAustrianBahamianBangladeshiBarbadianBasqueBelgianBelizeanBermudanBhutaneseBlackfeetBolivianBrazilianBritishBritish West IndianBulgarianBurmeseCajunCambodianCanadianCape VerdeanCarpatho RusynCelticCentral AmericanCentral American IndianCherokeeCheyenneChickasawChileanChineseChippewaChoctawColombianColvilleComancheCosta RicanCreeCreekCroatianCrowCubanCypriotCzechCzechoslovakianDanishDelawareDominicanDutchDutch West IndianEastern EuropeanEcuadorianEgyptianEnglishEstonianEthiopianEuropeanFijianFilipinoFinnishFrenchFrench American IndianFrench CanadianGermanGerman RussianGhanaianGreekGuamanian/ChamorroGuatemalanGuyaneseHaitianHmongHonduranHopiHoumaHungarianIcelanderIndian (Asian)IndonesianInupiatIranianIraqiIrishIroquoisIsraeliItalianJamaicanJapaneseJordanianKenyanKiowaKoreanLaotianLatvianLebaneseLiberianLithuanianLumbeeLuxembourgerMacedonianMalaysianMalteseMarshalleseMenomineeMexicanMexican American IndianMongolianMoroccanNative HawaiianNavajoNepaleseNew ZealanderNicaraguanNigerianNorthern EuropeanNorwegianOkinawanOsageOttawaPaiutePakistaniPalestinianPanamanianParaguayanPennsylvania GermanPeruvianPimaPolishPortuguesePotawatomiPuebloPuerto RicanPuget Sound SalishRomanianRussianSalvadoranSamoanScandinavianScotch-IrishScottishSeminoleSenegaleseSerbianShoshoneSierra LeoneanSiouxSlavicSlovakSloveneSomaliSouth AfricanSouth AmericanSouth American IndianSoviet UnionSpaniardSpanishSpanish AmericanSpanish American IndianSri LankanSubsaharan AfricanSudaneseSwedishSwissSyrianTaiwaneseThaiTlingit-HaidaTohono O'OdhamTonganTrinidadian and TobagonianTurkishU.S. Virgin IslanderUgandanUkrainianUruguayanUteVenezuelanVietnameseWelshWest IndianYakamaYaquiYugoslavianYumanYup'ikZimbabwean
Immigration
NonimmigrantsImmigrantsAfghanistanAfricaAlbaniaArgentinaArmeniaAsiaAustraliaAustriaBahamasBangladeshBarbadosBelarusBelgiumBelizeBoliviaBosnia and HerzegovinaBrazilBulgariaBurma/MyanmarCabo VerdeCambodiaCameroonCanadaCaribbeanCentral AmericaChileChinaColombiaCongoCosta RicaCroatiaCubaCzechoslovakiaDenmarkDominicaDominican RepublicEastern AfricaEastern AsiaEastern EuropeEcuadorEgyptEl SalvadorEnglandEritreaEthiopiaEuropeFijiFranceGermanyGhanaGreeceGrenadaGuatemalaGuyanaHaitiHondurasHong KongHungaryIndiaIndonesiaIranIraqIrelandIsraelItalyJamaicaJapanJordanKazakhstanKenyaKoreaKuwaitLaosLatin AmericaLatviaLebanonLiberiaLithuaniaMalaysiaMexicoMicronesiaMiddle AfricaMoldovaMoroccoNepalNetherlandsNicaraguaNigeriaNorth AmericaNorth MacedoniaNorthern AfricaNorthern EuropeNorwayOceaniaPakistanPanamaPeruPhilippinesPolandPortugalRomaniaRussiaSaudi ArabiaScotlandSenegalSerbiaSierra LeoneSingaporeSomaliaSouth AfricaSouth AmericaSouth Central AsiaSouth Eastern AsiaSouthern EuropeSpainSri LankaSt. Vincent and the GrenadinesSudanSwedenSwitzerlandSyriaTaiwanThailandTrinidad and TobagoTurkeyUgandaUkraineUruguayUzbekistanVenezuelaVietnamWest IndiesWestern AfricaWestern AsiaWestern EuropeYemenZaireZimbabweAzores
Single Father Poverty
Income
Poverty
Unemployment
Labor Participation
Family Structure
Vehicle Availability
Education Level
Disability

Single Father Poverty Comparison

Tsimshian

Immigrants from Nepal

Exceptional
Exceptional
12.7%
SINGLE FATHER POVERTY
100.0/ 100
METRIC RATING
3rd/ 347
METRIC RANK
14.8%
SINGLE FATHER POVERTY
100.0/ 100
METRIC RATING
42nd/ 347
METRIC RANK

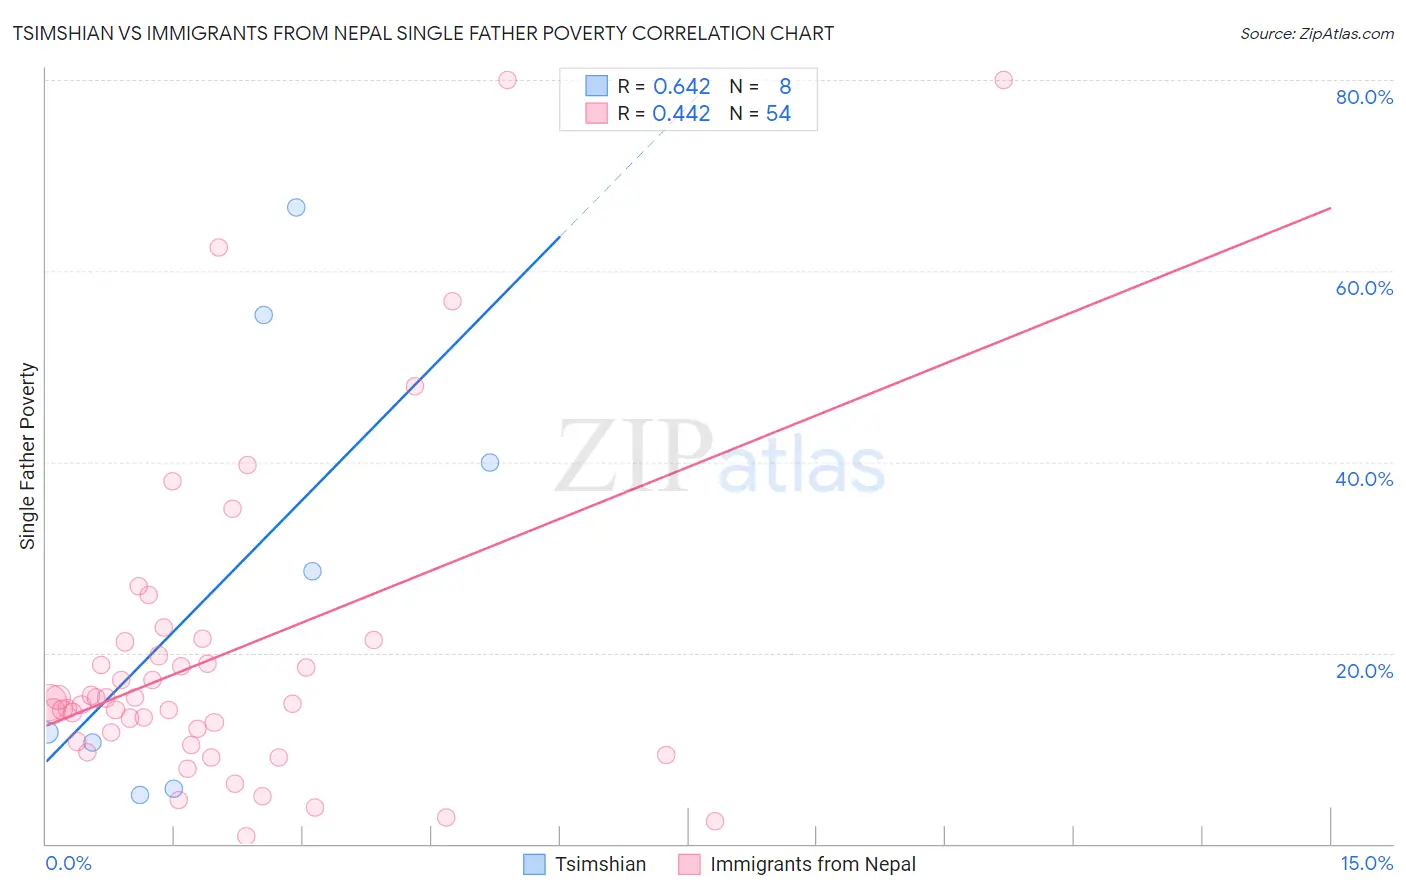
Tsimshian vs Immigrants from Nepal Single Father Poverty Correlation Chart

The statistical analysis conducted on geographies consisting of 14,553,815 people shows a significant positive correlation between the proportion of Tsimshian and poverty level among single fathers in the United States with a correlation coefficient (R) of 0.642 and weighted average of 12.7%. Similarly, the statistical analysis conducted on geographies consisting of 159,641,053 people shows a moderate positive correlation between the proportion of Immigrants from Nepal and poverty level among single fathers in the United States with a correlation coefficient (R) of 0.442 and weighted average of 14.8%, a difference of 16.5%.
Tsimshian vs Immigrants from Nepal Single Father Poverty

Single Father Poverty Correlation Summary

MeasurementTsimshianImmigrants from Nepal
Minimum5.1%0.76%
Maximum66.7%80.0%
Range61.5%79.2%
Mean28.0%19.8%
Median20.1%14.8%
Interquartile 25% (IQ1)8.1%10.7%
Interquartile 75% (IQ3)47.7%21.1%
Interquartile Range (IQR)39.6%10.5%
Standard Deviation (Sample)23.9%17.1%
Standard Deviation (Population)22.3%17.0%

Similar Demographics by Single Father Poverty

Demographics Similar to Tsimshian by Single Father Poverty

In terms of single father poverty, the demographic groups most similar to Tsimshian are Tongan (12.2%, a difference of 3.9%), Immigrants from Fiji (13.2%, a difference of 4.2%), Immigrants from Ethiopia (13.4%, a difference of 5.9%), Ethiopian (13.5%, a difference of 6.7%), and Immigrants from Taiwan (13.7%, a difference of 7.8%).
DemographicsRating | RankSingle Father Poverty
Assyrians/Chaldeans/Syriacs
100.0
/100
|
#1
Exceptional
11.7%
Tongans
100.0
/100
|
#2
Exceptional
12.2%
Tsimshian
100.0
/100
|
#3
Exceptional
12.7%
Immigrants | Fiji
100.0
/100
|
#4
Exceptional
13.2%
Immigrants | Ethiopia
100.0
/100
|
#5
Exceptional
13.4%
Ethiopians
100.0
/100
|
#6
Exceptional
13.5%
Immigrants | Taiwan
100.0
/100
|
#7
Exceptional
13.7%
Samoans
100.0
/100
|
#8
Exceptional
13.8%
Afghans
100.0
/100
|
#9
Exceptional
14.0%
Koreans
100.0
/100
|
#10
Exceptional
14.0%
Filipinos
100.0
/100
|
#11
Exceptional
14.0%
Immigrants | India
100.0
/100
|
#12
Exceptional
14.0%
Immigrants | Philippines
100.0
/100
|
#13
Exceptional
14.0%
Immigrants | Vietnam
100.0
/100
|
#14
Exceptional
14.1%
Sri Lankans
100.0
/100
|
#15
Exceptional
14.2%

Demographics Similar to Immigrants from Nepal by Single Father Poverty

In terms of single father poverty, the demographic groups most similar to Immigrants from Nepal are Indian (Asian) (14.8%, a difference of 0.0%), Immigrants from Eritrea (14.8%, a difference of 0.040%), Pima (14.8%, a difference of 0.17%), Immigrants from Asia (14.7%, a difference of 0.37%), and Bolivian (14.7%, a difference of 0.55%).
DemographicsRating | RankSingle Father Poverty
Immigrants | Bolivia
100.0
/100
|
#35
Exceptional
14.7%
Immigrants | Indonesia
100.0
/100
|
#36
Exceptional
14.7%
Immigrants | Eastern Africa
100.0
/100
|
#37
Exceptional
14.7%
Bolivians
100.0
/100
|
#38
Exceptional
14.7%
Immigrants | Asia
100.0
/100
|
#39
Exceptional
14.7%
Pima
100.0
/100
|
#40
Exceptional
14.8%
Indians (Asian)
100.0
/100
|
#41
Exceptional
14.8%
Immigrants | Nepal
100.0
/100
|
#42
Exceptional
14.8%
Immigrants | Eritrea
100.0
/100
|
#43
Exceptional
14.8%
Salvadorans
100.0
/100
|
#44
Exceptional
14.9%
Immigrants | Somalia
100.0
/100
|
#45
Exceptional
14.9%
Immigrants | Cambodia
99.9
/100
|
#46
Exceptional
14.9%
Immigrants | China
99.9
/100
|
#47
Exceptional
14.9%
Malaysians
99.9
/100
|
#48
Exceptional
14.9%
Immigrants | Eastern Asia
99.9
/100
|
#49
Exceptional
15.0%