Tsimshian vs Arab Single Father Poverty
COMPARE
Tsimshian
Arab
Single Father Poverty
Single Father Poverty Comparison
Tsimshian
Arabs
12.7%
SINGLE FATHER POVERTY
100.0/ 100
METRIC RATING
3rd/ 347
METRIC RANK
16.6%
SINGLE FATHER POVERTY
12.8/ 100
METRIC RATING
211th/ 347
METRIC RANK
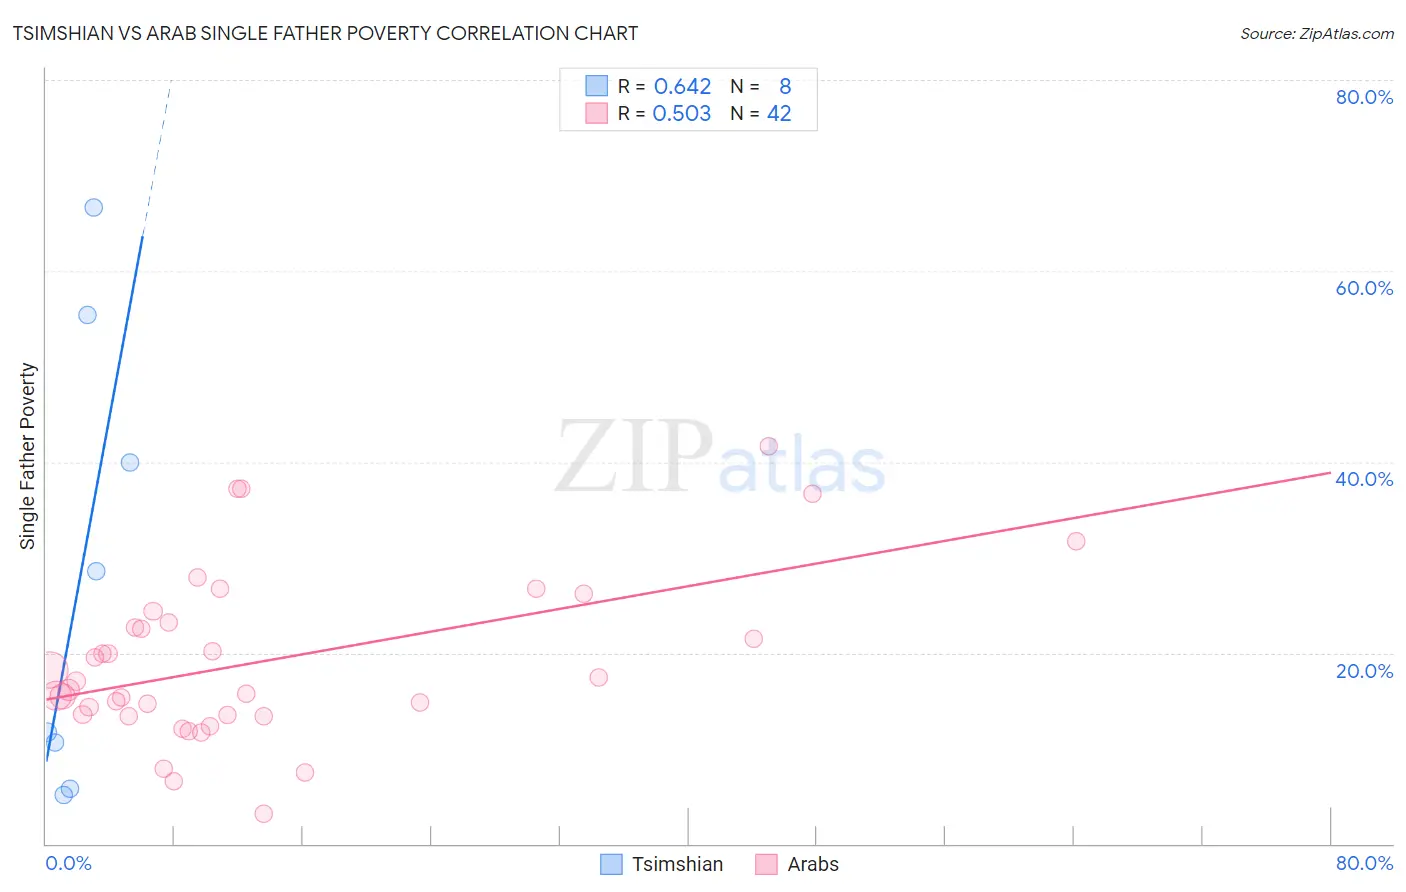
Tsimshian vs Arab Single Father Poverty Correlation Chart
The statistical analysis conducted on geographies consisting of 14,553,815 people shows a significant positive correlation between the proportion of Tsimshian and poverty level among single fathers in the United States with a correlation coefficient (R) of 0.642 and weighted average of 12.7%. Similarly, the statistical analysis conducted on geographies consisting of 369,349,186 people shows a substantial positive correlation between the proportion of Arabs and poverty level among single fathers in the United States with a correlation coefficient (R) of 0.503 and weighted average of 16.6%, a difference of 31.0%.
Single Father Poverty Correlation Summary
| Measurement | Tsimshian | Arab |
| Minimum | 5.1% | 3.2% |
| Maximum | 66.7% | 41.6% |
| Range | 61.5% | 38.4% |
| Mean | 28.0% | 19.1% |
| Median | 20.1% | 16.6% |
| Interquartile 25% (IQ1) | 8.1% | 13.5% |
| Interquartile 75% (IQ3) | 47.7% | 23.1% |
| Interquartile Range (IQR) | 39.6% | 9.6% |
| Standard Deviation (Sample) | 23.9% | 8.7% |
| Standard Deviation (Population) | 22.3% | 8.6% |
Similar Demographics by Single Father Poverty
Demographics Similar to Tsimshian by Single Father Poverty
In terms of single father poverty, the demographic groups most similar to Tsimshian are Tongan (12.2%, a difference of 3.9%), Immigrants from Fiji (13.2%, a difference of 4.2%), Immigrants from Ethiopia (13.4%, a difference of 5.9%), Ethiopian (13.5%, a difference of 6.7%), and Immigrants from Taiwan (13.7%, a difference of 7.8%).
| Demographics | Rating | Rank | Single Father Poverty |
| Assyrians/Chaldeans/Syriacs | 100.0 /100 | #1 | Exceptional 11.7% |
| Tongans | 100.0 /100 | #2 | Exceptional 12.2% |
| Tsimshian | 100.0 /100 | #3 | Exceptional 12.7% |
| Immigrants | Fiji | 100.0 /100 | #4 | Exceptional 13.2% |
| Immigrants | Ethiopia | 100.0 /100 | #5 | Exceptional 13.4% |
| Ethiopians | 100.0 /100 | #6 | Exceptional 13.5% |
| Immigrants | Taiwan | 100.0 /100 | #7 | Exceptional 13.7% |
| Samoans | 100.0 /100 | #8 | Exceptional 13.8% |
| Afghans | 100.0 /100 | #9 | Exceptional 14.0% |
| Koreans | 100.0 /100 | #10 | Exceptional 14.0% |
| Filipinos | 100.0 /100 | #11 | Exceptional 14.0% |
| Immigrants | India | 100.0 /100 | #12 | Exceptional 14.0% |
| Immigrants | Philippines | 100.0 /100 | #13 | Exceptional 14.0% |
| Immigrants | Vietnam | 100.0 /100 | #14 | Exceptional 14.1% |
| Sri Lankans | 100.0 /100 | #15 | Exceptional 14.2% |
Demographics Similar to Arabs by Single Father Poverty
In terms of single father poverty, the demographic groups most similar to Arabs are Guatemalan (16.6%, a difference of 0.0%), European (16.6%, a difference of 0.030%), Immigrants from Senegal (16.6%, a difference of 0.080%), New Zealander (16.6%, a difference of 0.080%), and Eastern European (16.6%, a difference of 0.080%).
| Demographics | Rating | Rank | Single Father Poverty |
| Immigrants | Guatemala | 14.8 /100 | #204 | Poor 16.6% |
| Venezuelans | 14.3 /100 | #205 | Poor 16.6% |
| Immigrants | Senegal | 13.7 /100 | #206 | Poor 16.6% |
| New Zealanders | 13.7 /100 | #207 | Poor 16.6% |
| Eastern Europeans | 13.7 /100 | #208 | Poor 16.6% |
| Europeans | 13.2 /100 | #209 | Poor 16.6% |
| Guatemalans | 12.9 /100 | #210 | Poor 16.6% |
| Arabs | 12.8 /100 | #211 | Poor 16.6% |
| Immigrants | Southern Europe | 11.2 /100 | #212 | Poor 16.7% |
| Ghanaians | 11.0 /100 | #213 | Poor 16.7% |
| Spanish | 10.7 /100 | #214 | Poor 16.7% |
| Immigrants | Scotland | 9.6 /100 | #215 | Tragic 16.7% |
| Immigrants | England | 9.5 /100 | #216 | Tragic 16.7% |
| Cheyenne | 9.3 /100 | #217 | Tragic 16.7% |
| Immigrants | Uganda | 8.6 /100 | #218 | Tragic 16.7% |