Tongan vs Immigrants from Czechoslovakia Single Father Poverty
COMPARE
Tongan
Immigrants from Czechoslovakia
Single Father Poverty
Single Father Poverty Comparison
Tongans
Immigrants from Czechoslovakia
12.2%
SINGLE FATHER POVERTY
100.0/ 100
METRIC RATING
2nd/ 347
METRIC RANK
16.2%
SINGLE FATHER POVERTY
62.8/ 100
METRIC RATING
157th/ 347
METRIC RANK
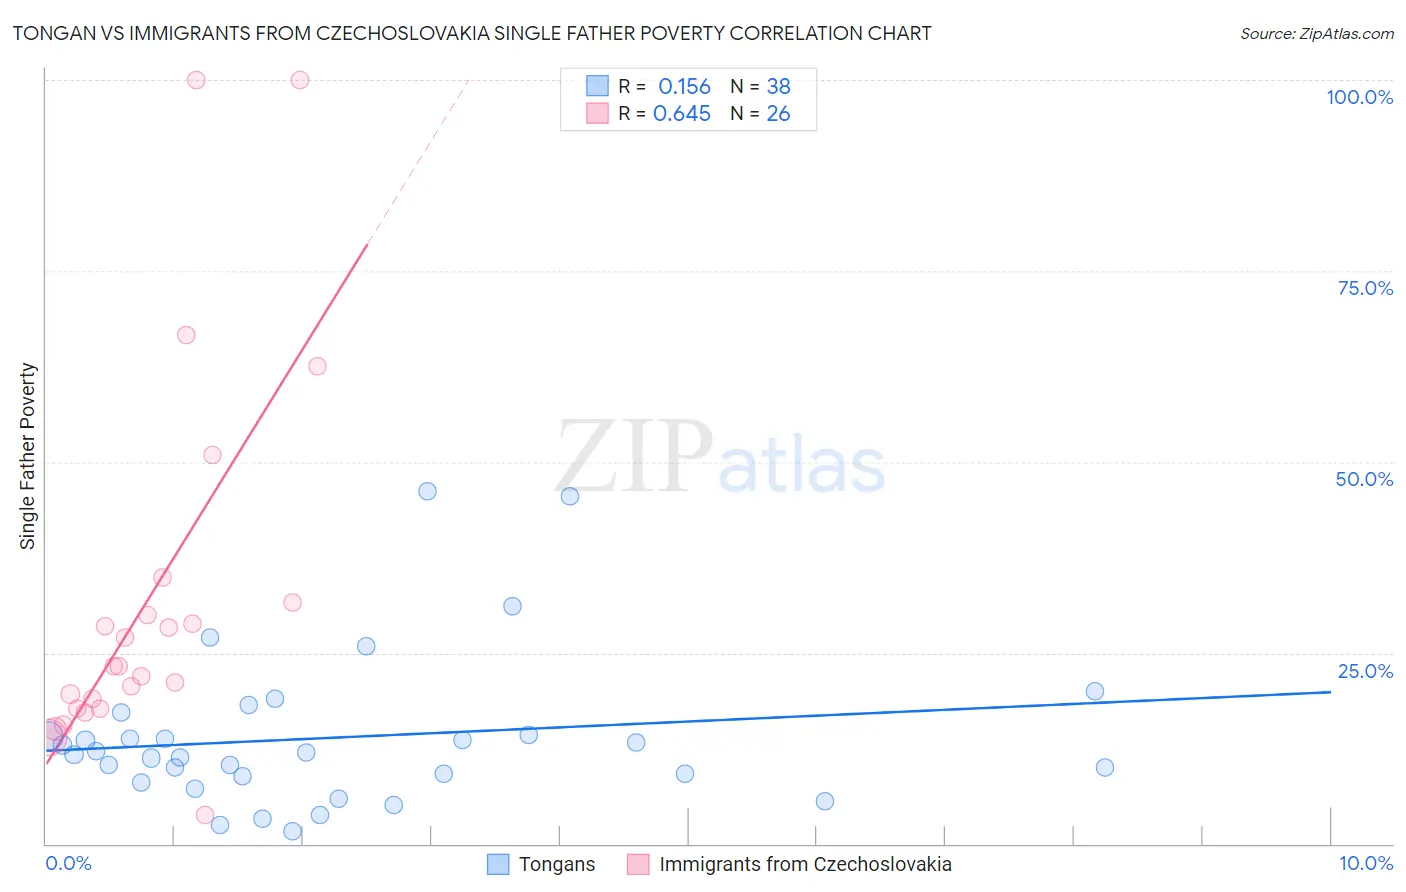
Tongan vs Immigrants from Czechoslovakia Single Father Poverty Correlation Chart
The statistical analysis conducted on geographies consisting of 92,788,841 people shows a poor positive correlation between the proportion of Tongans and poverty level among single fathers in the United States with a correlation coefficient (R) of 0.156 and weighted average of 12.2%. Similarly, the statistical analysis conducted on geographies consisting of 162,409,027 people shows a significant positive correlation between the proportion of Immigrants from Czechoslovakia and poverty level among single fathers in the United States with a correlation coefficient (R) of 0.645 and weighted average of 16.2%, a difference of 32.6%.
Single Father Poverty Correlation Summary
| Measurement | Tongan | Immigrants from Czechoslovakia |
| Minimum | 1.7% | 3.7% |
| Maximum | 46.2% | 100.0% |
| Range | 44.4% | 96.3% |
| Mean | 13.9% | 32.3% |
| Median | 11.8% | 23.3% |
| Interquartile 25% (IQ1) | 8.8% | 17.7% |
| Interquartile 75% (IQ3) | 14.3% | 31.6% |
| Interquartile Range (IQR) | 5.5% | 14.0% |
| Standard Deviation (Sample) | 10.0% | 24.4% |
| Standard Deviation (Population) | 9.8% | 24.0% |
Similar Demographics by Single Father Poverty
Demographics Similar to Tongans by Single Father Poverty
In terms of single father poverty, the demographic groups most similar to Tongans are Tsimshian (12.7%, a difference of 3.9%), Assyrian/Chaldean/Syriac (11.7%, a difference of 4.2%), Immigrants from Fiji (13.2%, a difference of 8.3%), Immigrants from Ethiopia (13.4%, a difference of 10.0%), and Ethiopian (13.5%, a difference of 10.9%).
| Demographics | Rating | Rank | Single Father Poverty |
| Assyrians/Chaldeans/Syriacs | 100.0 /100 | #1 | Exceptional 11.7% |
| Tongans | 100.0 /100 | #2 | Exceptional 12.2% |
| Tsimshian | 100.0 /100 | #3 | Exceptional 12.7% |
| Immigrants | Fiji | 100.0 /100 | #4 | Exceptional 13.2% |
| Immigrants | Ethiopia | 100.0 /100 | #5 | Exceptional 13.4% |
| Ethiopians | 100.0 /100 | #6 | Exceptional 13.5% |
| Immigrants | Taiwan | 100.0 /100 | #7 | Exceptional 13.7% |
| Samoans | 100.0 /100 | #8 | Exceptional 13.8% |
| Afghans | 100.0 /100 | #9 | Exceptional 14.0% |
| Koreans | 100.0 /100 | #10 | Exceptional 14.0% |
| Filipinos | 100.0 /100 | #11 | Exceptional 14.0% |
| Immigrants | India | 100.0 /100 | #12 | Exceptional 14.0% |
| Immigrants | Philippines | 100.0 /100 | #13 | Exceptional 14.0% |
| Immigrants | Vietnam | 100.0 /100 | #14 | Exceptional 14.1% |
| Sri Lankans | 100.0 /100 | #15 | Exceptional 14.2% |
Demographics Similar to Immigrants from Czechoslovakia by Single Father Poverty
In terms of single father poverty, the demographic groups most similar to Immigrants from Czechoslovakia are Portuguese (16.2%, a difference of 0.020%), Belizean (16.2%, a difference of 0.14%), Immigrants from Sudan (16.2%, a difference of 0.14%), Immigrants from Jordan (16.2%, a difference of 0.16%), and Immigrants from Nicaragua (16.2%, a difference of 0.25%).
| Demographics | Rating | Rank | Single Father Poverty |
| Jordanians | 74.2 /100 | #150 | Good 16.1% |
| Immigrants | France | 73.1 /100 | #151 | Good 16.1% |
| Immigrants | Zimbabwe | 72.1 /100 | #152 | Good 16.1% |
| Immigrants | Israel | 72.0 /100 | #153 | Good 16.1% |
| Mexicans | 70.1 /100 | #154 | Good 16.1% |
| Immigrants | Nicaragua | 67.8 /100 | #155 | Good 16.2% |
| Immigrants | Jordan | 66.0 /100 | #156 | Good 16.2% |
| Immigrants | Czechoslovakia | 62.8 /100 | #157 | Good 16.2% |
| Portuguese | 62.3 /100 | #158 | Good 16.2% |
| Belizeans | 59.9 /100 | #159 | Average 16.2% |
| Immigrants | Sudan | 59.8 /100 | #160 | Average 16.2% |
| Estonians | 56.7 /100 | #161 | Average 16.2% |
| Ugandans | 55.9 /100 | #162 | Average 16.3% |
| Immigrants | Costa Rica | 55.7 /100 | #163 | Average 16.3% |
| Guyanese | 55.2 /100 | #164 | Average 16.3% |