Tongan vs Immigrants from Bulgaria Single Father Poverty
COMPARE
Tongan
Immigrants from Bulgaria
Single Father Poverty
Single Father Poverty Comparison
Tongans
Immigrants from Bulgaria
12.2%
SINGLE FATHER POVERTY
100.0/ 100
METRIC RATING
2nd/ 347
METRIC RANK
15.0%
SINGLE FATHER POVERTY
99.9/ 100
METRIC RATING
55th/ 347
METRIC RANK
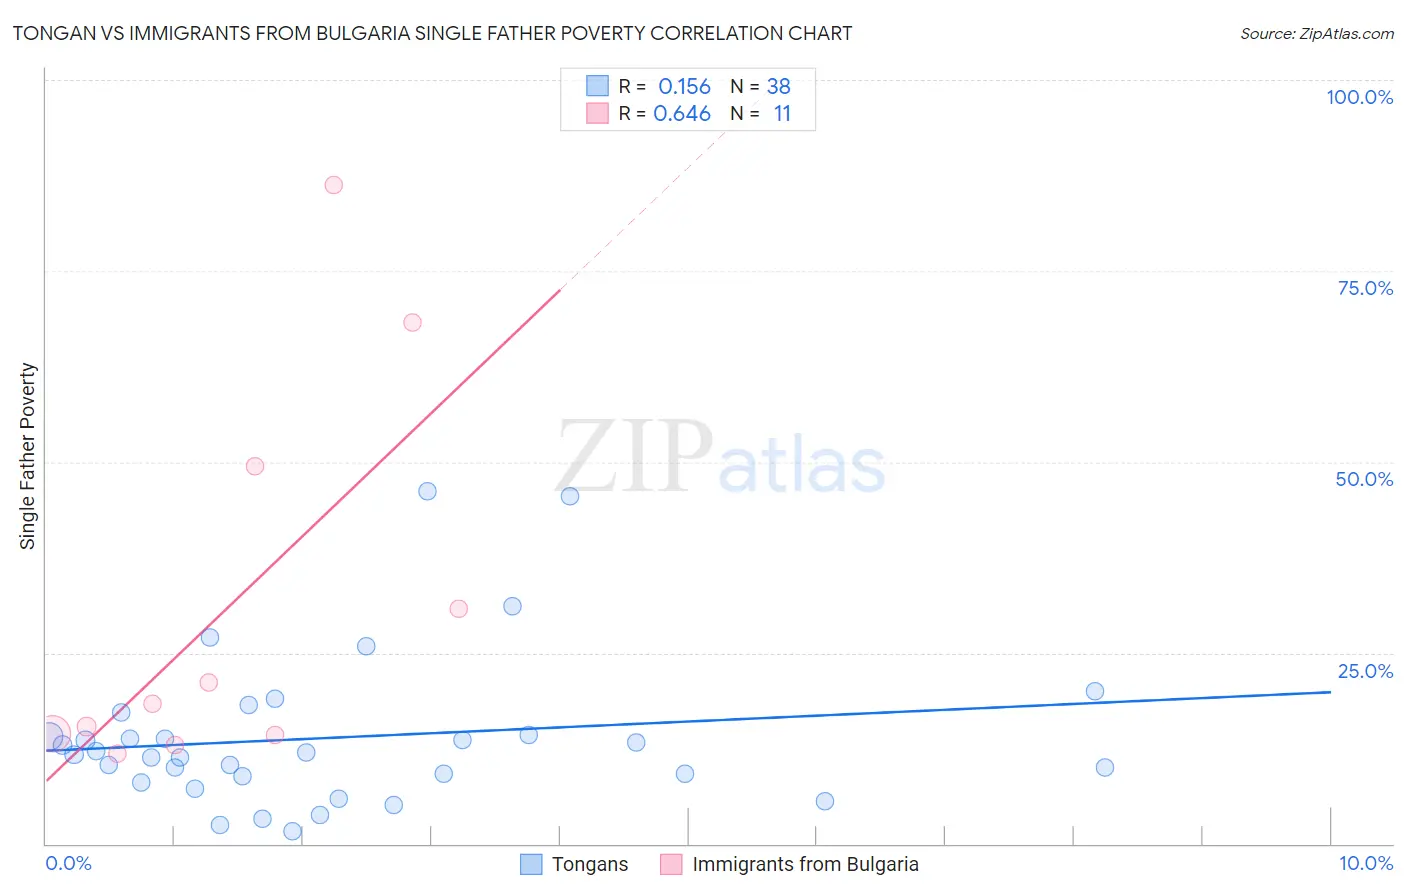
Tongan vs Immigrants from Bulgaria Single Father Poverty Correlation Chart
The statistical analysis conducted on geographies consisting of 92,788,841 people shows a poor positive correlation between the proportion of Tongans and poverty level among single fathers in the United States with a correlation coefficient (R) of 0.156 and weighted average of 12.2%. Similarly, the statistical analysis conducted on geographies consisting of 145,942,181 people shows a significant positive correlation between the proportion of Immigrants from Bulgaria and poverty level among single fathers in the United States with a correlation coefficient (R) of 0.646 and weighted average of 15.0%, a difference of 22.9%.
Single Father Poverty Correlation Summary
| Measurement | Tongan | Immigrants from Bulgaria |
| Minimum | 1.7% | 11.8% |
| Maximum | 46.2% | 86.2% |
| Range | 44.4% | 74.4% |
| Mean | 13.9% | 31.2% |
| Median | 11.8% | 18.3% |
| Interquartile 25% (IQ1) | 8.8% | 14.3% |
| Interquartile 75% (IQ3) | 14.3% | 49.4% |
| Interquartile Range (IQR) | 5.5% | 35.1% |
| Standard Deviation (Sample) | 10.0% | 25.5% |
| Standard Deviation (Population) | 9.8% | 24.4% |
Similar Demographics by Single Father Poverty
Demographics Similar to Tongans by Single Father Poverty
In terms of single father poverty, the demographic groups most similar to Tongans are Tsimshian (12.7%, a difference of 3.9%), Assyrian/Chaldean/Syriac (11.7%, a difference of 4.2%), Immigrants from Fiji (13.2%, a difference of 8.3%), Immigrants from Ethiopia (13.4%, a difference of 10.0%), and Ethiopian (13.5%, a difference of 10.9%).
| Demographics | Rating | Rank | Single Father Poverty |
| Assyrians/Chaldeans/Syriacs | 100.0 /100 | #1 | Exceptional 11.7% |
| Tongans | 100.0 /100 | #2 | Exceptional 12.2% |
| Tsimshian | 100.0 /100 | #3 | Exceptional 12.7% |
| Immigrants | Fiji | 100.0 /100 | #4 | Exceptional 13.2% |
| Immigrants | Ethiopia | 100.0 /100 | #5 | Exceptional 13.4% |
| Ethiopians | 100.0 /100 | #6 | Exceptional 13.5% |
| Immigrants | Taiwan | 100.0 /100 | #7 | Exceptional 13.7% |
| Samoans | 100.0 /100 | #8 | Exceptional 13.8% |
| Afghans | 100.0 /100 | #9 | Exceptional 14.0% |
| Koreans | 100.0 /100 | #10 | Exceptional 14.0% |
| Filipinos | 100.0 /100 | #11 | Exceptional 14.0% |
| Immigrants | India | 100.0 /100 | #12 | Exceptional 14.0% |
| Immigrants | Philippines | 100.0 /100 | #13 | Exceptional 14.0% |
| Immigrants | Vietnam | 100.0 /100 | #14 | Exceptional 14.1% |
| Sri Lankans | 100.0 /100 | #15 | Exceptional 14.2% |
Demographics Similar to Immigrants from Bulgaria by Single Father Poverty
In terms of single father poverty, the demographic groups most similar to Immigrants from Bulgaria are Immigrants from Uzbekistan (15.0%, a difference of 0.050%), Immigrants from Kenya (15.0%, a difference of 0.23%), Immigrants from El Salvador (15.0%, a difference of 0.26%), Immigrants from Laos (15.1%, a difference of 0.28%), and Immigrants from Pakistan (15.0%, a difference of 0.30%).
| Demographics | Rating | Rank | Single Father Poverty |
| Malaysians | 99.9 /100 | #48 | Exceptional 14.9% |
| Immigrants | Eastern Asia | 99.9 /100 | #49 | Exceptional 15.0% |
| Bhutanese | 99.9 /100 | #50 | Exceptional 15.0% |
| Immigrants | Pakistan | 99.9 /100 | #51 | Exceptional 15.0% |
| Immigrants | El Salvador | 99.9 /100 | #52 | Exceptional 15.0% |
| Immigrants | Kenya | 99.9 /100 | #53 | Exceptional 15.0% |
| Immigrants | Uzbekistan | 99.9 /100 | #54 | Exceptional 15.0% |
| Immigrants | Bulgaria | 99.9 /100 | #55 | Exceptional 15.0% |
| Immigrants | Laos | 99.9 /100 | #56 | Exceptional 15.1% |
| Laotians | 99.9 /100 | #57 | Exceptional 15.1% |
| Hawaiians | 99.9 /100 | #58 | Exceptional 15.1% |
| Guamanians/Chamorros | 99.9 /100 | #59 | Exceptional 15.1% |
| Puget Sound Salish | 99.8 /100 | #60 | Exceptional 15.2% |
| Immigrants | Bosnia and Herzegovina | 99.8 /100 | #61 | Exceptional 15.2% |
| Immigrants | Armenia | 99.8 /100 | #62 | Exceptional 15.2% |