Nepalese vs Immigrants from Czechoslovakia Single Father Poverty
COMPARE
Nepalese
Immigrants from Czechoslovakia
Single Father Poverty
Single Father Poverty Comparison
Nepalese
Immigrants from Czechoslovakia
14.4%
SINGLE FATHER POVERTY
100.0/ 100
METRIC RATING
27th/ 347
METRIC RANK
16.2%
SINGLE FATHER POVERTY
62.8/ 100
METRIC RATING
157th/ 347
METRIC RANK
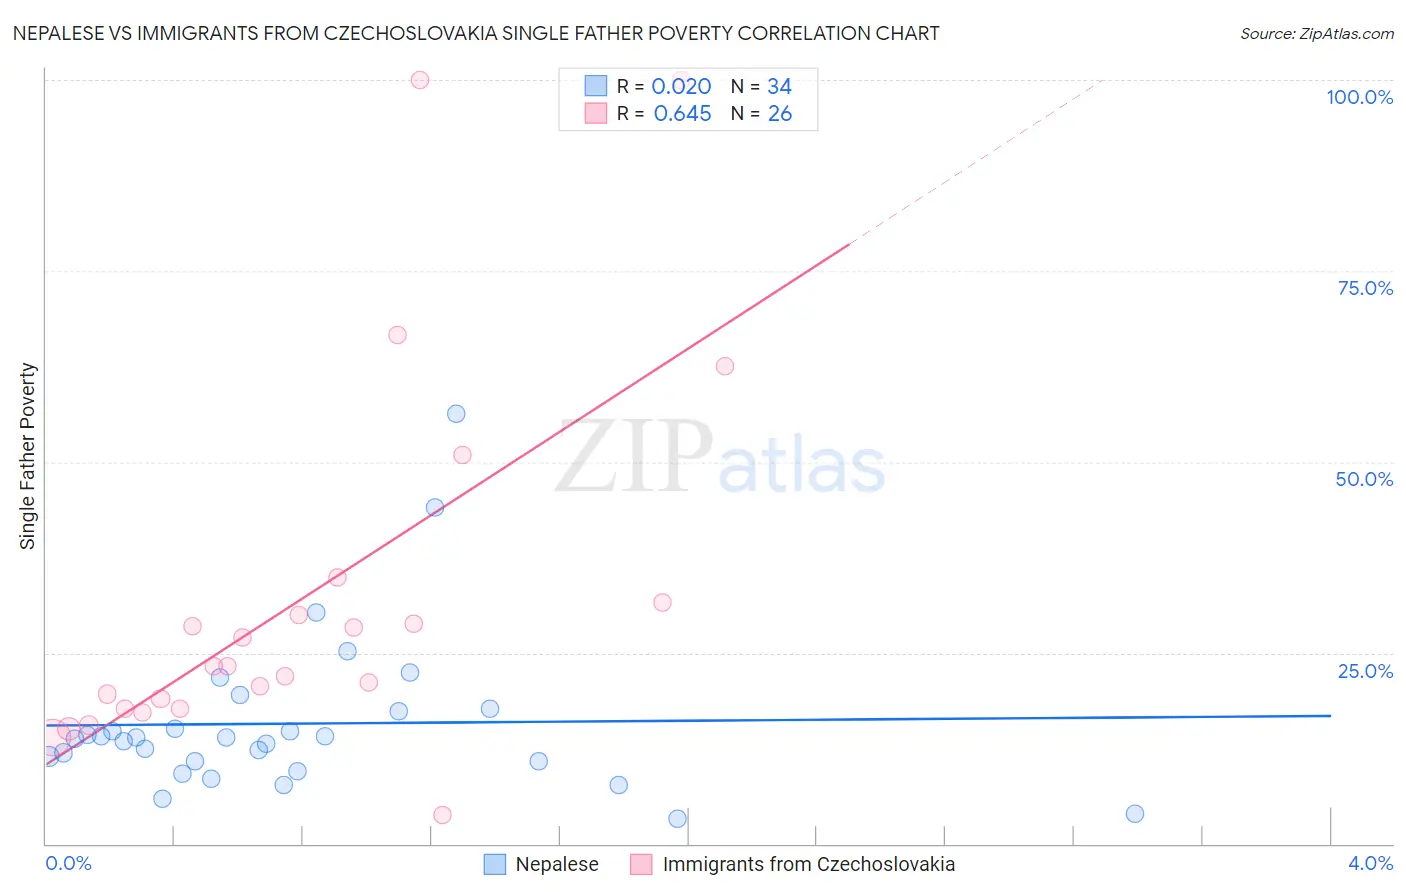
Nepalese vs Immigrants from Czechoslovakia Single Father Poverty Correlation Chart
The statistical analysis conducted on geographies consisting of 23,366,556 people shows no correlation between the proportion of Nepalese and poverty level among single fathers in the United States with a correlation coefficient (R) of 0.020 and weighted average of 14.4%. Similarly, the statistical analysis conducted on geographies consisting of 162,409,027 people shows a significant positive correlation between the proportion of Immigrants from Czechoslovakia and poverty level among single fathers in the United States with a correlation coefficient (R) of 0.645 and weighted average of 16.2%, a difference of 12.3%.
Single Father Poverty Correlation Summary
| Measurement | Nepalese | Immigrants from Czechoslovakia |
| Minimum | 3.3% | 3.7% |
| Maximum | 56.2% | 100.0% |
| Range | 52.9% | 96.3% |
| Mean | 15.7% | 32.3% |
| Median | 13.8% | 23.3% |
| Interquartile 25% (IQ1) | 10.8% | 17.7% |
| Interquartile 75% (IQ3) | 17.3% | 31.6% |
| Interquartile Range (IQR) | 6.5% | 14.0% |
| Standard Deviation (Sample) | 10.5% | 24.4% |
| Standard Deviation (Population) | 10.3% | 24.0% |
Similar Demographics by Single Father Poverty
Demographics Similar to Nepalese by Single Father Poverty
In terms of single father poverty, the demographic groups most similar to Nepalese are Spanish American Indian (14.4%, a difference of 0.050%), Iranian (14.4%, a difference of 0.48%), Immigrants from South Eastern Asia (14.4%, a difference of 0.51%), Immigrants from Egypt (14.4%, a difference of 0.52%), and Immigrants from South Central Asia (14.5%, a difference of 0.53%).
| Demographics | Rating | Rank | Single Father Poverty |
| Immigrants | Singapore | 100.0 /100 | #20 | Exceptional 14.3% |
| Immigrants | Afghanistan | 100.0 /100 | #21 | Exceptional 14.3% |
| Taiwanese | 100.0 /100 | #22 | Exceptional 14.3% |
| Immigrants | Egypt | 100.0 /100 | #23 | Exceptional 14.4% |
| Immigrants | South Eastern Asia | 100.0 /100 | #24 | Exceptional 14.4% |
| Iranians | 100.0 /100 | #25 | Exceptional 14.4% |
| Spanish American Indians | 100.0 /100 | #26 | Exceptional 14.4% |
| Nepalese | 100.0 /100 | #27 | Exceptional 14.4% |
| Immigrants | South Central Asia | 100.0 /100 | #28 | Exceptional 14.5% |
| Somalis | 100.0 /100 | #29 | Exceptional 14.5% |
| Thais | 100.0 /100 | #30 | Exceptional 14.5% |
| Icelanders | 100.0 /100 | #31 | Exceptional 14.5% |
| Asians | 100.0 /100 | #32 | Exceptional 14.6% |
| Okinawans | 100.0 /100 | #33 | Exceptional 14.6% |
| Egyptians | 100.0 /100 | #34 | Exceptional 14.7% |
Demographics Similar to Immigrants from Czechoslovakia by Single Father Poverty
In terms of single father poverty, the demographic groups most similar to Immigrants from Czechoslovakia are Portuguese (16.2%, a difference of 0.020%), Belizean (16.2%, a difference of 0.14%), Immigrants from Sudan (16.2%, a difference of 0.14%), Immigrants from Jordan (16.2%, a difference of 0.16%), and Immigrants from Nicaragua (16.2%, a difference of 0.25%).
| Demographics | Rating | Rank | Single Father Poverty |
| Jordanians | 74.2 /100 | #150 | Good 16.1% |
| Immigrants | France | 73.1 /100 | #151 | Good 16.1% |
| Immigrants | Zimbabwe | 72.1 /100 | #152 | Good 16.1% |
| Immigrants | Israel | 72.0 /100 | #153 | Good 16.1% |
| Mexicans | 70.1 /100 | #154 | Good 16.1% |
| Immigrants | Nicaragua | 67.8 /100 | #155 | Good 16.2% |
| Immigrants | Jordan | 66.0 /100 | #156 | Good 16.2% |
| Immigrants | Czechoslovakia | 62.8 /100 | #157 | Good 16.2% |
| Portuguese | 62.3 /100 | #158 | Good 16.2% |
| Belizeans | 59.9 /100 | #159 | Average 16.2% |
| Immigrants | Sudan | 59.8 /100 | #160 | Average 16.2% |
| Estonians | 56.7 /100 | #161 | Average 16.2% |
| Ugandans | 55.9 /100 | #162 | Average 16.3% |
| Immigrants | Costa Rica | 55.7 /100 | #163 | Average 16.3% |
| Guyanese | 55.2 /100 | #164 | Average 16.3% |