Immigrants from Haiti vs Immigrants from Czechoslovakia Single Father Poverty
COMPARE
Immigrants from Haiti
Immigrants from Czechoslovakia
Single Father Poverty
Single Father Poverty Comparison
Immigrants from Haiti
Immigrants from Czechoslovakia
17.2%
SINGLE FATHER POVERTY
0.8/ 100
METRIC RATING
256th/ 347
METRIC RANK
16.2%
SINGLE FATHER POVERTY
62.8/ 100
METRIC RATING
157th/ 347
METRIC RANK
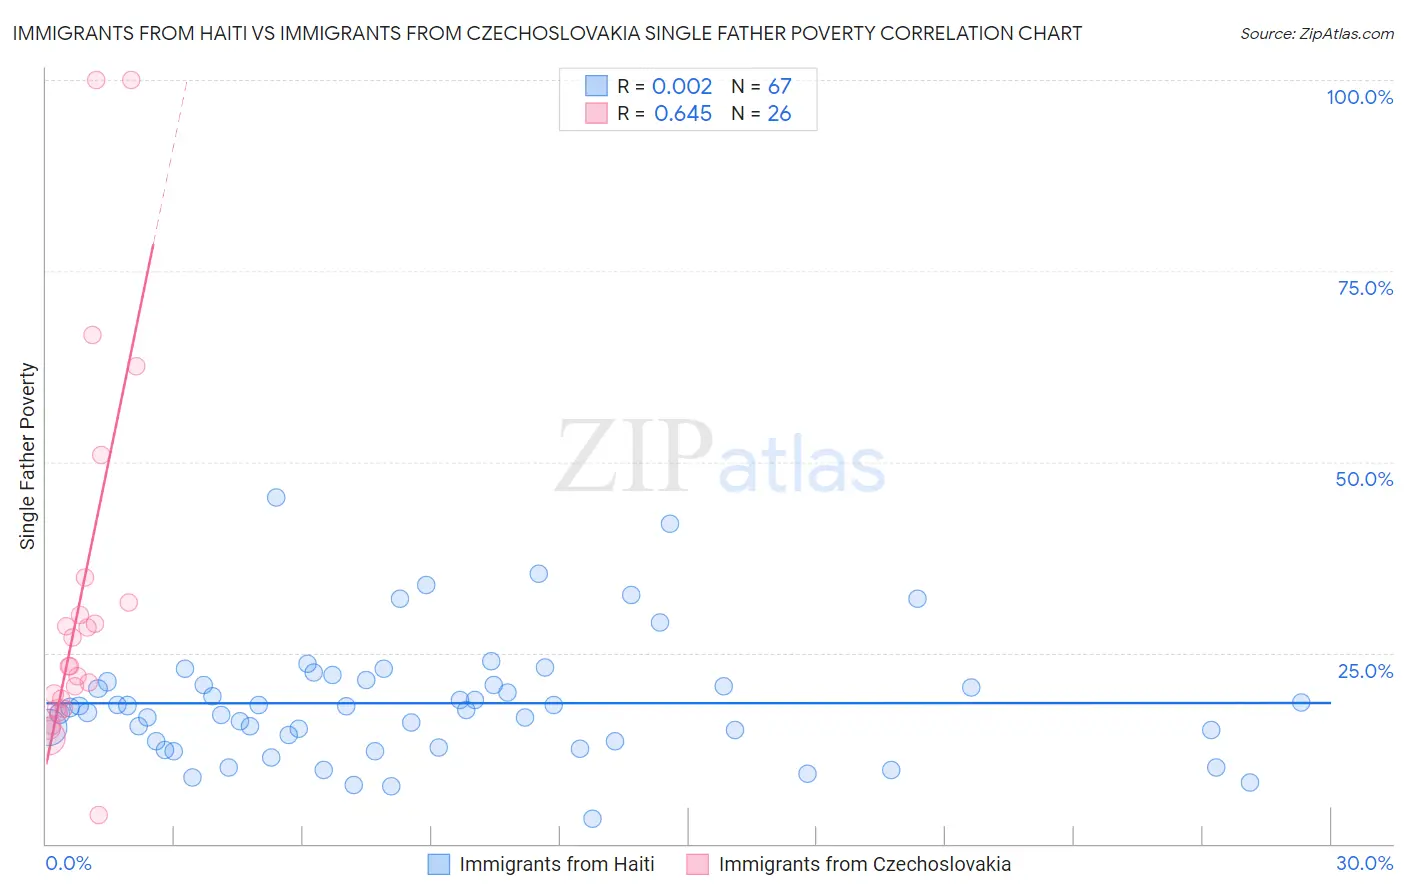
Immigrants from Haiti vs Immigrants from Czechoslovakia Single Father Poverty Correlation Chart
The statistical analysis conducted on geographies consisting of 189,968,112 people shows no correlation between the proportion of Immigrants from Haiti and poverty level among single fathers in the United States with a correlation coefficient (R) of 0.002 and weighted average of 17.2%. Similarly, the statistical analysis conducted on geographies consisting of 162,409,027 people shows a significant positive correlation between the proportion of Immigrants from Czechoslovakia and poverty level among single fathers in the United States with a correlation coefficient (R) of 0.645 and weighted average of 16.2%, a difference of 6.0%.
Single Father Poverty Correlation Summary
| Measurement | Immigrants from Haiti | Immigrants from Czechoslovakia |
| Minimum | 3.3% | 3.7% |
| Maximum | 45.4% | 100.0% |
| Range | 42.1% | 96.3% |
| Mean | 18.4% | 32.3% |
| Median | 17.8% | 23.3% |
| Interquartile 25% (IQ1) | 13.4% | 17.7% |
| Interquartile 75% (IQ3) | 21.2% | 31.6% |
| Interquartile Range (IQR) | 7.8% | 14.0% |
| Standard Deviation (Sample) | 7.9% | 24.4% |
| Standard Deviation (Population) | 7.8% | 24.0% |
Similar Demographics by Single Father Poverty
Demographics Similar to Immigrants from Haiti by Single Father Poverty
In terms of single father poverty, the demographic groups most similar to Immigrants from Haiti are Sierra Leonean (17.2%, a difference of 0.010%), Immigrants from Albania (17.2%, a difference of 0.080%), Albanian (17.2%, a difference of 0.10%), Immigrants from Jamaica (17.2%, a difference of 0.13%), and Immigrants from Honduras (17.1%, a difference of 0.19%).
| Demographics | Rating | Rank | Single Father Poverty |
| Canadians | 1.3 /100 | #249 | Tragic 17.1% |
| Austrians | 1.1 /100 | #250 | Tragic 17.1% |
| Luxembourgers | 1.1 /100 | #251 | Tragic 17.1% |
| Croatians | 1.0 /100 | #252 | Tragic 17.1% |
| Cree | 1.0 /100 | #253 | Tragic 17.1% |
| Immigrants | Honduras | 0.9 /100 | #254 | Tragic 17.1% |
| Sierra Leoneans | 0.8 /100 | #255 | Tragic 17.2% |
| Immigrants | Haiti | 0.8 /100 | #256 | Tragic 17.2% |
| Immigrants | Albania | 0.7 /100 | #257 | Tragic 17.2% |
| Albanians | 0.7 /100 | #258 | Tragic 17.2% |
| Immigrants | Jamaica | 0.7 /100 | #259 | Tragic 17.2% |
| Spaniards | 0.6 /100 | #260 | Tragic 17.2% |
| Swiss | 0.5 /100 | #261 | Tragic 17.3% |
| Immigrants | Zaire | 0.4 /100 | #262 | Tragic 17.3% |
| Lithuanians | 0.4 /100 | #263 | Tragic 17.3% |
Demographics Similar to Immigrants from Czechoslovakia by Single Father Poverty
In terms of single father poverty, the demographic groups most similar to Immigrants from Czechoslovakia are Portuguese (16.2%, a difference of 0.020%), Belizean (16.2%, a difference of 0.14%), Immigrants from Sudan (16.2%, a difference of 0.14%), Immigrants from Jordan (16.2%, a difference of 0.16%), and Immigrants from Nicaragua (16.2%, a difference of 0.25%).
| Demographics | Rating | Rank | Single Father Poverty |
| Jordanians | 74.2 /100 | #150 | Good 16.1% |
| Immigrants | France | 73.1 /100 | #151 | Good 16.1% |
| Immigrants | Zimbabwe | 72.1 /100 | #152 | Good 16.1% |
| Immigrants | Israel | 72.0 /100 | #153 | Good 16.1% |
| Mexicans | 70.1 /100 | #154 | Good 16.1% |
| Immigrants | Nicaragua | 67.8 /100 | #155 | Good 16.2% |
| Immigrants | Jordan | 66.0 /100 | #156 | Good 16.2% |
| Immigrants | Czechoslovakia | 62.8 /100 | #157 | Good 16.2% |
| Portuguese | 62.3 /100 | #158 | Good 16.2% |
| Belizeans | 59.9 /100 | #159 | Average 16.2% |
| Immigrants | Sudan | 59.8 /100 | #160 | Average 16.2% |
| Estonians | 56.7 /100 | #161 | Average 16.2% |
| Ugandans | 55.9 /100 | #162 | Average 16.3% |
| Immigrants | Costa Rica | 55.7 /100 | #163 | Average 16.3% |
| Guyanese | 55.2 /100 | #164 | Average 16.3% |