Tongan vs Guyanese Single Father Poverty
COMPARE
Tongan
Guyanese
Single Father Poverty
Single Father Poverty Comparison
Tongans
Guyanese
12.2%
SINGLE FATHER POVERTY
100.0/ 100
METRIC RATING
2nd/ 347
METRIC RANK
16.3%
SINGLE FATHER POVERTY
55.2/ 100
METRIC RATING
164th/ 347
METRIC RANK
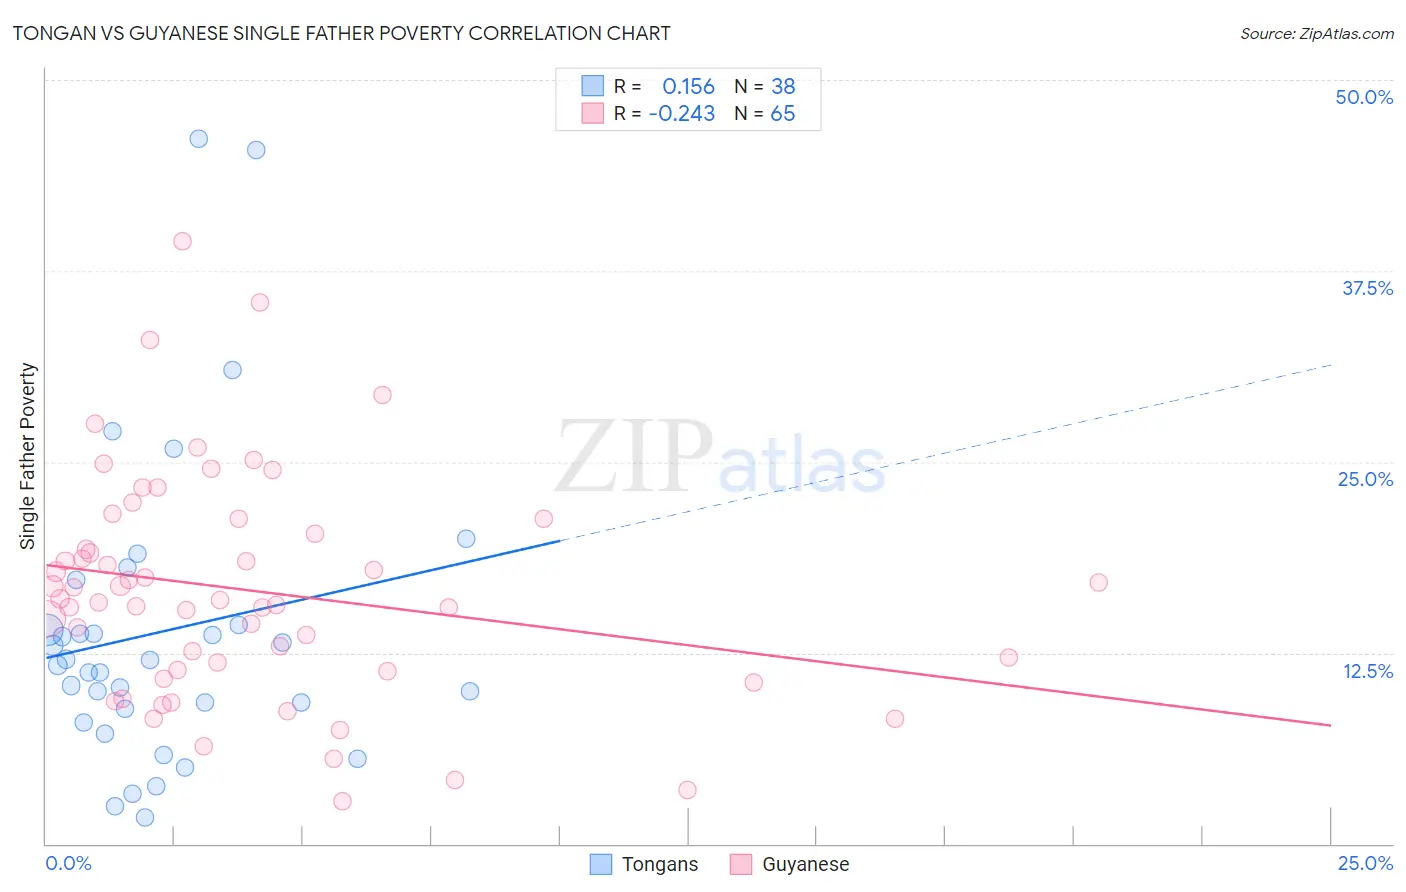
Tongan vs Guyanese Single Father Poverty Correlation Chart
The statistical analysis conducted on geographies consisting of 92,788,841 people shows a poor positive correlation between the proportion of Tongans and poverty level among single fathers in the United States with a correlation coefficient (R) of 0.156 and weighted average of 12.2%. Similarly, the statistical analysis conducted on geographies consisting of 153,215,231 people shows a weak negative correlation between the proportion of Guyanese and poverty level among single fathers in the United States with a correlation coefficient (R) of -0.243 and weighted average of 16.3%, a difference of 33.1%.
Single Father Poverty Correlation Summary
| Measurement | Tongan | Guyanese |
| Minimum | 1.7% | 2.8% |
| Maximum | 46.2% | 39.5% |
| Range | 44.4% | 36.7% |
| Mean | 13.9% | 16.6% |
| Median | 11.8% | 16.0% |
| Interquartile 25% (IQ1) | 8.8% | 11.3% |
| Interquartile 75% (IQ3) | 14.3% | 20.8% |
| Interquartile Range (IQR) | 5.5% | 9.4% |
| Standard Deviation (Sample) | 10.0% | 7.4% |
| Standard Deviation (Population) | 9.8% | 7.3% |
Similar Demographics by Single Father Poverty
Demographics Similar to Tongans by Single Father Poverty
In terms of single father poverty, the demographic groups most similar to Tongans are Tsimshian (12.7%, a difference of 3.9%), Assyrian/Chaldean/Syriac (11.7%, a difference of 4.2%), Immigrants from Fiji (13.2%, a difference of 8.3%), Immigrants from Ethiopia (13.4%, a difference of 10.0%), and Ethiopian (13.5%, a difference of 10.9%).
| Demographics | Rating | Rank | Single Father Poverty |
| Assyrians/Chaldeans/Syriacs | 100.0 /100 | #1 | Exceptional 11.7% |
| Tongans | 100.0 /100 | #2 | Exceptional 12.2% |
| Tsimshian | 100.0 /100 | #3 | Exceptional 12.7% |
| Immigrants | Fiji | 100.0 /100 | #4 | Exceptional 13.2% |
| Immigrants | Ethiopia | 100.0 /100 | #5 | Exceptional 13.4% |
| Ethiopians | 100.0 /100 | #6 | Exceptional 13.5% |
| Immigrants | Taiwan | 100.0 /100 | #7 | Exceptional 13.7% |
| Samoans | 100.0 /100 | #8 | Exceptional 13.8% |
| Afghans | 100.0 /100 | #9 | Exceptional 14.0% |
| Koreans | 100.0 /100 | #10 | Exceptional 14.0% |
| Filipinos | 100.0 /100 | #11 | Exceptional 14.0% |
| Immigrants | India | 100.0 /100 | #12 | Exceptional 14.0% |
| Immigrants | Philippines | 100.0 /100 | #13 | Exceptional 14.0% |
| Immigrants | Vietnam | 100.0 /100 | #14 | Exceptional 14.1% |
| Sri Lankans | 100.0 /100 | #15 | Exceptional 14.2% |
Demographics Similar to Guyanese by Single Father Poverty
In terms of single father poverty, the demographic groups most similar to Guyanese are Immigrants from Bangladesh (16.3%, a difference of 0.0%), Immigrants from Europe (16.3%, a difference of 0.010%), Immigrants from Costa Rica (16.3%, a difference of 0.020%), Ugandan (16.3%, a difference of 0.030%), and Yugoslavian (16.3%, a difference of 0.060%).
| Demographics | Rating | Rank | Single Father Poverty |
| Immigrants | Czechoslovakia | 62.8 /100 | #157 | Good 16.2% |
| Portuguese | 62.3 /100 | #158 | Good 16.2% |
| Belizeans | 59.9 /100 | #159 | Average 16.2% |
| Immigrants | Sudan | 59.8 /100 | #160 | Average 16.2% |
| Estonians | 56.7 /100 | #161 | Average 16.2% |
| Ugandans | 55.9 /100 | #162 | Average 16.3% |
| Immigrants | Costa Rica | 55.7 /100 | #163 | Average 16.3% |
| Guyanese | 55.2 /100 | #164 | Average 16.3% |
| Immigrants | Bangladesh | 55.1 /100 | #165 | Average 16.3% |
| Immigrants | Europe | 54.8 /100 | #166 | Average 16.3% |
| Yugoslavians | 53.9 /100 | #167 | Average 16.3% |
| Costa Ricans | 53.6 /100 | #168 | Average 16.3% |
| Northern Europeans | 52.8 /100 | #169 | Average 16.3% |
| Scandinavians | 52.3 /100 | #170 | Average 16.3% |
| Immigrants | Morocco | 50.7 /100 | #171 | Average 16.3% |