Tongan vs Bermudan Single Father Poverty
COMPARE
Tongan
Bermudan
Single Father Poverty
Single Father Poverty Comparison
Tongans
Bermudans
12.2%
SINGLE FATHER POVERTY
100.0/ 100
METRIC RATING
2nd/ 347
METRIC RANK
16.9%
SINGLE FATHER POVERTY
2.6/ 100
METRIC RATING
239th/ 347
METRIC RANK
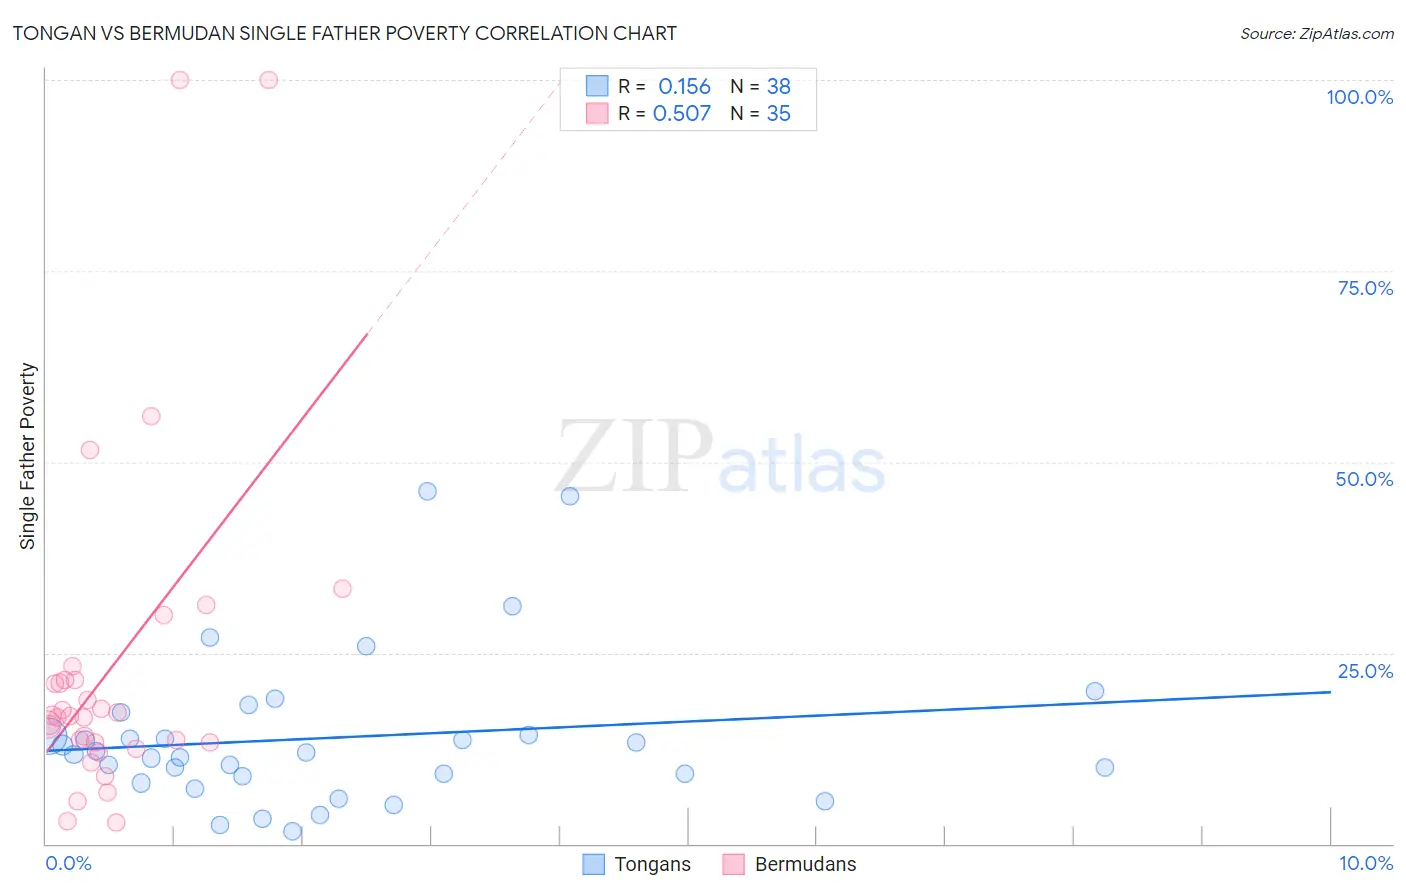
Tongan vs Bermudan Single Father Poverty Correlation Chart
The statistical analysis conducted on geographies consisting of 92,788,841 people shows a poor positive correlation between the proportion of Tongans and poverty level among single fathers in the United States with a correlation coefficient (R) of 0.156 and weighted average of 12.2%. Similarly, the statistical analysis conducted on geographies consisting of 52,766,587 people shows a substantial positive correlation between the proportion of Bermudans and poverty level among single fathers in the United States with a correlation coefficient (R) of 0.507 and weighted average of 16.9%, a difference of 38.7%.
Single Father Poverty Correlation Summary
| Measurement | Tongan | Bermudan |
| Minimum | 1.7% | 2.7% |
| Maximum | 46.2% | 100.0% |
| Range | 44.4% | 97.3% |
| Mean | 13.9% | 23.1% |
| Median | 11.8% | 16.7% |
| Interquartile 25% (IQ1) | 8.8% | 13.2% |
| Interquartile 75% (IQ3) | 14.3% | 21.5% |
| Interquartile Range (IQR) | 5.5% | 8.2% |
| Standard Deviation (Sample) | 10.0% | 22.2% |
| Standard Deviation (Population) | 9.8% | 21.9% |
Similar Demographics by Single Father Poverty
Demographics Similar to Tongans by Single Father Poverty
In terms of single father poverty, the demographic groups most similar to Tongans are Tsimshian (12.7%, a difference of 3.9%), Assyrian/Chaldean/Syriac (11.7%, a difference of 4.2%), Immigrants from Fiji (13.2%, a difference of 8.3%), Immigrants from Ethiopia (13.4%, a difference of 10.0%), and Ethiopian (13.5%, a difference of 10.9%).
| Demographics | Rating | Rank | Single Father Poverty |
| Assyrians/Chaldeans/Syriacs | 100.0 /100 | #1 | Exceptional 11.7% |
| Tongans | 100.0 /100 | #2 | Exceptional 12.2% |
| Tsimshian | 100.0 /100 | #3 | Exceptional 12.7% |
| Immigrants | Fiji | 100.0 /100 | #4 | Exceptional 13.2% |
| Immigrants | Ethiopia | 100.0 /100 | #5 | Exceptional 13.4% |
| Ethiopians | 100.0 /100 | #6 | Exceptional 13.5% |
| Immigrants | Taiwan | 100.0 /100 | #7 | Exceptional 13.7% |
| Samoans | 100.0 /100 | #8 | Exceptional 13.8% |
| Afghans | 100.0 /100 | #9 | Exceptional 14.0% |
| Koreans | 100.0 /100 | #10 | Exceptional 14.0% |
| Filipinos | 100.0 /100 | #11 | Exceptional 14.0% |
| Immigrants | India | 100.0 /100 | #12 | Exceptional 14.0% |
| Immigrants | Philippines | 100.0 /100 | #13 | Exceptional 14.0% |
| Immigrants | Vietnam | 100.0 /100 | #14 | Exceptional 14.1% |
| Sri Lankans | 100.0 /100 | #15 | Exceptional 14.2% |
Demographics Similar to Bermudans by Single Father Poverty
In terms of single father poverty, the demographic groups most similar to Bermudans are Finnish (16.9%, a difference of 0.010%), Immigrants from Saudi Arabia (16.9%, a difference of 0.020%), Immigrants from Western Europe (16.9%, a difference of 0.090%), Immigrants from Germany (16.9%, a difference of 0.090%), and Subsaharan African (16.9%, a difference of 0.090%).
| Demographics | Rating | Rank | Single Father Poverty |
| Immigrants | Grenada | 3.7 /100 | #232 | Tragic 16.9% |
| Senegalese | 3.2 /100 | #233 | Tragic 16.9% |
| Marshallese | 3.1 /100 | #234 | Tragic 16.9% |
| Immigrants | Western Europe | 2.9 /100 | #235 | Tragic 16.9% |
| Immigrants | Germany | 2.9 /100 | #236 | Tragic 16.9% |
| Sub-Saharan Africans | 2.9 /100 | #237 | Tragic 16.9% |
| Immigrants | Saudi Arabia | 2.7 /100 | #238 | Tragic 16.9% |
| Bermudans | 2.6 /100 | #239 | Tragic 16.9% |
| Finns | 2.6 /100 | #240 | Tragic 16.9% |
| Czechs | 2.3 /100 | #241 | Tragic 17.0% |
| Moroccans | 2.1 /100 | #242 | Tragic 17.0% |
| Immigrants | Cabo Verde | 1.6 /100 | #243 | Tragic 17.0% |
| Hondurans | 1.6 /100 | #244 | Tragic 17.0% |
| Trinidadians and Tobagonians | 1.5 /100 | #245 | Tragic 17.0% |
| Immigrants | Ireland | 1.4 /100 | #246 | Tragic 17.1% |