Alsatian vs Immigrants from Czechoslovakia Single Father Poverty
COMPARE
Alsatian
Immigrants from Czechoslovakia
Single Father Poverty
Single Father Poverty Comparison
Alsatians
Immigrants from Czechoslovakia
17.8%
SINGLE FATHER POVERTY
0.0/ 100
METRIC RATING
283rd/ 347
METRIC RANK
16.2%
SINGLE FATHER POVERTY
62.8/ 100
METRIC RATING
157th/ 347
METRIC RANK
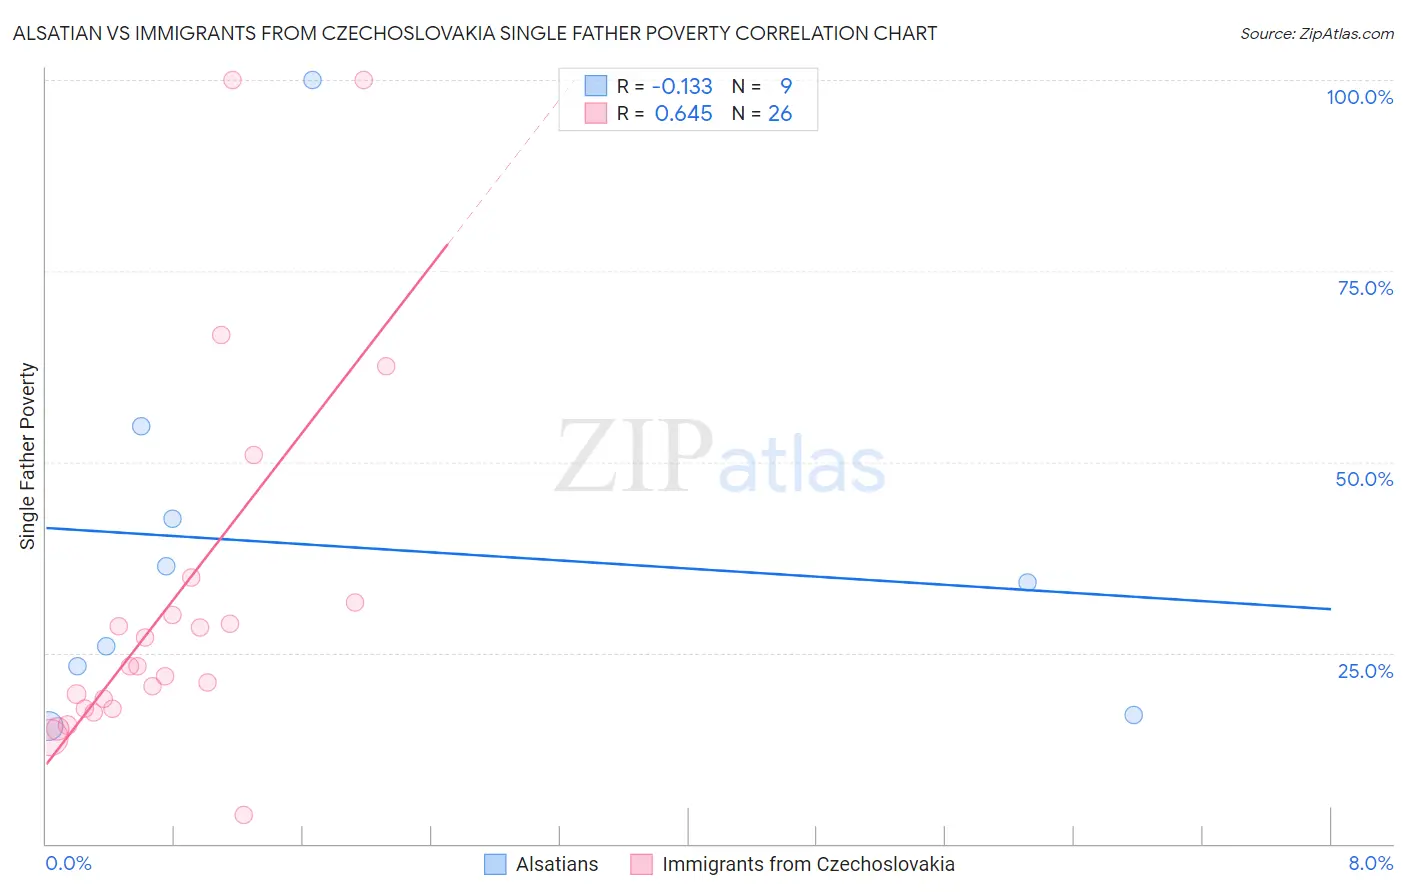
Alsatian vs Immigrants from Czechoslovakia Single Father Poverty Correlation Chart
The statistical analysis conducted on geographies consisting of 73,758,627 people shows a poor negative correlation between the proportion of Alsatians and poverty level among single fathers in the United States with a correlation coefficient (R) of -0.133 and weighted average of 17.8%. Similarly, the statistical analysis conducted on geographies consisting of 162,409,027 people shows a significant positive correlation between the proportion of Immigrants from Czechoslovakia and poverty level among single fathers in the United States with a correlation coefficient (R) of 0.645 and weighted average of 16.2%, a difference of 10.0%.
Single Father Poverty Correlation Summary
| Measurement | Alsatian | Immigrants from Czechoslovakia |
| Minimum | 15.4% | 3.7% |
| Maximum | 100.0% | 100.0% |
| Range | 84.6% | 96.3% |
| Mean | 38.8% | 32.3% |
| Median | 34.2% | 23.3% |
| Interquartile 25% (IQ1) | 20.1% | 17.7% |
| Interquartile 75% (IQ3) | 48.6% | 31.6% |
| Interquartile Range (IQR) | 28.5% | 14.0% |
| Standard Deviation (Sample) | 26.2% | 24.4% |
| Standard Deviation (Population) | 24.7% | 24.0% |
Similar Demographics by Single Father Poverty
Demographics Similar to Alsatians by Single Father Poverty
In terms of single father poverty, the demographic groups most similar to Alsatians are Welsh (17.8%, a difference of 0.020%), English (17.8%, a difference of 0.10%), Dutch (17.8%, a difference of 0.10%), Immigrants from Lebanon (17.9%, a difference of 0.38%), and Scottish (17.7%, a difference of 0.42%).
| Demographics | Rating | Rank | Single Father Poverty |
| German Russians | 0.0 /100 | #276 | Tragic 17.7% |
| Lebanese | 0.0 /100 | #277 | Tragic 17.7% |
| Germans | 0.0 /100 | #278 | Tragic 17.7% |
| Iroquois | 0.0 /100 | #279 | Tragic 17.7% |
| Scottish | 0.0 /100 | #280 | Tragic 17.7% |
| English | 0.0 /100 | #281 | Tragic 17.8% |
| Dutch | 0.0 /100 | #282 | Tragic 17.8% |
| Alsatians | 0.0 /100 | #283 | Tragic 17.8% |
| Welsh | 0.0 /100 | #284 | Tragic 17.8% |
| Immigrants | Lebanon | 0.0 /100 | #285 | Tragic 17.9% |
| Immigrants | North Macedonia | 0.0 /100 | #286 | Tragic 17.9% |
| Carpatho Rusyns | 0.0 /100 | #287 | Tragic 18.0% |
| Bahamians | 0.0 /100 | #288 | Tragic 18.0% |
| Irish | 0.0 /100 | #289 | Tragic 18.0% |
| West Indians | 0.0 /100 | #290 | Tragic 18.0% |
Demographics Similar to Immigrants from Czechoslovakia by Single Father Poverty
In terms of single father poverty, the demographic groups most similar to Immigrants from Czechoslovakia are Portuguese (16.2%, a difference of 0.020%), Belizean (16.2%, a difference of 0.14%), Immigrants from Sudan (16.2%, a difference of 0.14%), Immigrants from Jordan (16.2%, a difference of 0.16%), and Immigrants from Nicaragua (16.2%, a difference of 0.25%).
| Demographics | Rating | Rank | Single Father Poverty |
| Jordanians | 74.2 /100 | #150 | Good 16.1% |
| Immigrants | France | 73.1 /100 | #151 | Good 16.1% |
| Immigrants | Zimbabwe | 72.1 /100 | #152 | Good 16.1% |
| Immigrants | Israel | 72.0 /100 | #153 | Good 16.1% |
| Mexicans | 70.1 /100 | #154 | Good 16.1% |
| Immigrants | Nicaragua | 67.8 /100 | #155 | Good 16.2% |
| Immigrants | Jordan | 66.0 /100 | #156 | Good 16.2% |
| Immigrants | Czechoslovakia | 62.8 /100 | #157 | Good 16.2% |
| Portuguese | 62.3 /100 | #158 | Good 16.2% |
| Belizeans | 59.9 /100 | #159 | Average 16.2% |
| Immigrants | Sudan | 59.8 /100 | #160 | Average 16.2% |
| Estonians | 56.7 /100 | #161 | Average 16.2% |
| Ugandans | 55.9 /100 | #162 | Average 16.3% |
| Immigrants | Costa Rica | 55.7 /100 | #163 | Average 16.3% |
| Guyanese | 55.2 /100 | #164 | Average 16.3% |