Tongan vs Welsh Single Father Poverty
COMPARE
Tongan
Welsh
Single Father Poverty
Single Father Poverty Comparison
Tongans
Welsh
12.2%
SINGLE FATHER POVERTY
100.0/ 100
METRIC RATING
2nd/ 347
METRIC RANK
17.8%
SINGLE FATHER POVERTY
0.0/ 100
METRIC RATING
284th/ 347
METRIC RANK
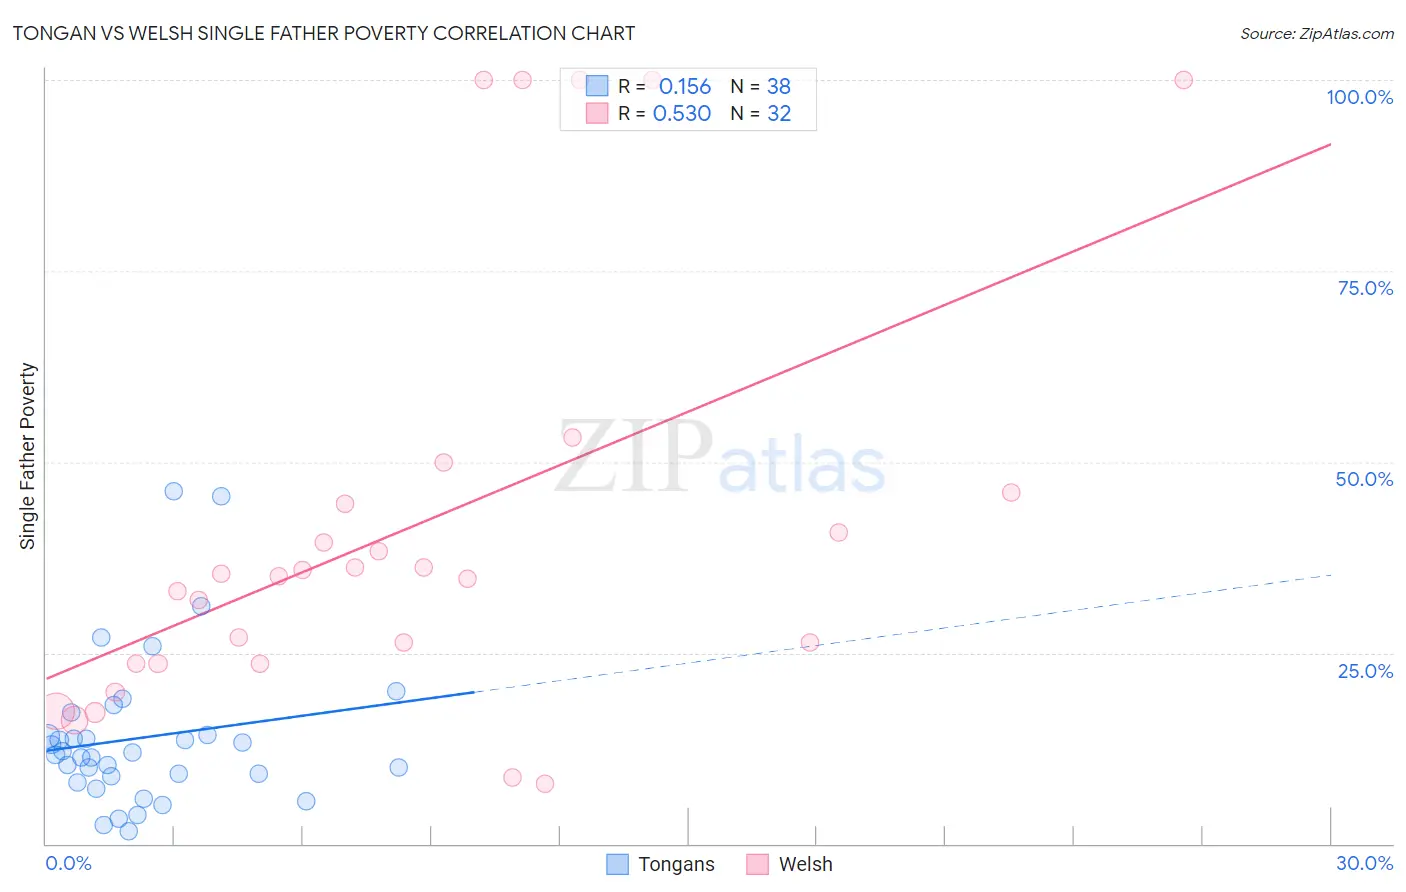
Tongan vs Welsh Single Father Poverty Correlation Chart
The statistical analysis conducted on geographies consisting of 92,788,841 people shows a poor positive correlation between the proportion of Tongans and poverty level among single fathers in the United States with a correlation coefficient (R) of 0.156 and weighted average of 12.2%. Similarly, the statistical analysis conducted on geographies consisting of 385,351,851 people shows a substantial positive correlation between the proportion of Welsh and poverty level among single fathers in the United States with a correlation coefficient (R) of 0.530 and weighted average of 17.8%, a difference of 45.9%.
Single Father Poverty Correlation Summary
| Measurement | Tongan | Welsh |
| Minimum | 1.7% | 7.8% |
| Maximum | 46.2% | 100.0% |
| Range | 44.4% | 92.2% |
| Mean | 13.9% | 41.5% |
| Median | 11.8% | 35.2% |
| Interquartile 25% (IQ1) | 8.8% | 23.6% |
| Interquartile 75% (IQ3) | 14.3% | 45.3% |
| Interquartile Range (IQR) | 5.5% | 21.7% |
| Standard Deviation (Sample) | 10.0% | 27.8% |
| Standard Deviation (Population) | 9.8% | 27.3% |
Similar Demographics by Single Father Poverty
Demographics Similar to Tongans by Single Father Poverty
In terms of single father poverty, the demographic groups most similar to Tongans are Tsimshian (12.7%, a difference of 3.9%), Assyrian/Chaldean/Syriac (11.7%, a difference of 4.2%), Immigrants from Fiji (13.2%, a difference of 8.3%), Immigrants from Ethiopia (13.4%, a difference of 10.0%), and Ethiopian (13.5%, a difference of 10.9%).
| Demographics | Rating | Rank | Single Father Poverty |
| Assyrians/Chaldeans/Syriacs | 100.0 /100 | #1 | Exceptional 11.7% |
| Tongans | 100.0 /100 | #2 | Exceptional 12.2% |
| Tsimshian | 100.0 /100 | #3 | Exceptional 12.7% |
| Immigrants | Fiji | 100.0 /100 | #4 | Exceptional 13.2% |
| Immigrants | Ethiopia | 100.0 /100 | #5 | Exceptional 13.4% |
| Ethiopians | 100.0 /100 | #6 | Exceptional 13.5% |
| Immigrants | Taiwan | 100.0 /100 | #7 | Exceptional 13.7% |
| Samoans | 100.0 /100 | #8 | Exceptional 13.8% |
| Afghans | 100.0 /100 | #9 | Exceptional 14.0% |
| Koreans | 100.0 /100 | #10 | Exceptional 14.0% |
| Filipinos | 100.0 /100 | #11 | Exceptional 14.0% |
| Immigrants | India | 100.0 /100 | #12 | Exceptional 14.0% |
| Immigrants | Philippines | 100.0 /100 | #13 | Exceptional 14.0% |
| Immigrants | Vietnam | 100.0 /100 | #14 | Exceptional 14.1% |
| Sri Lankans | 100.0 /100 | #15 | Exceptional 14.2% |
Demographics Similar to Welsh by Single Father Poverty
In terms of single father poverty, the demographic groups most similar to Welsh are Alsatian (17.8%, a difference of 0.020%), Dutch (17.8%, a difference of 0.11%), English (17.8%, a difference of 0.12%), Immigrants from Lebanon (17.9%, a difference of 0.37%), and Scottish (17.7%, a difference of 0.43%).
| Demographics | Rating | Rank | Single Father Poverty |
| Lebanese | 0.0 /100 | #277 | Tragic 17.7% |
| Germans | 0.0 /100 | #278 | Tragic 17.7% |
| Iroquois | 0.0 /100 | #279 | Tragic 17.7% |
| Scottish | 0.0 /100 | #280 | Tragic 17.7% |
| English | 0.0 /100 | #281 | Tragic 17.8% |
| Dutch | 0.0 /100 | #282 | Tragic 17.8% |
| Alsatians | 0.0 /100 | #283 | Tragic 17.8% |
| Welsh | 0.0 /100 | #284 | Tragic 17.8% |
| Immigrants | Lebanon | 0.0 /100 | #285 | Tragic 17.9% |
| Immigrants | North Macedonia | 0.0 /100 | #286 | Tragic 17.9% |
| Carpatho Rusyns | 0.0 /100 | #287 | Tragic 18.0% |
| Bahamians | 0.0 /100 | #288 | Tragic 18.0% |
| Irish | 0.0 /100 | #289 | Tragic 18.0% |
| West Indians | 0.0 /100 | #290 | Tragic 18.0% |
| Alaskan Athabascans | 0.0 /100 | #291 | Tragic 18.1% |