Tlingit-Haida vs Immigrants from Czechoslovakia Single Father Poverty
COMPARE
Tlingit-Haida
Immigrants from Czechoslovakia
Single Father Poverty
Single Father Poverty Comparison
Tlingit-Haida
Immigrants from Czechoslovakia
15.3%
SINGLE FATHER POVERTY
99.5/ 100
METRIC RATING
78th/ 347
METRIC RANK
16.2%
SINGLE FATHER POVERTY
62.8/ 100
METRIC RATING
157th/ 347
METRIC RANK
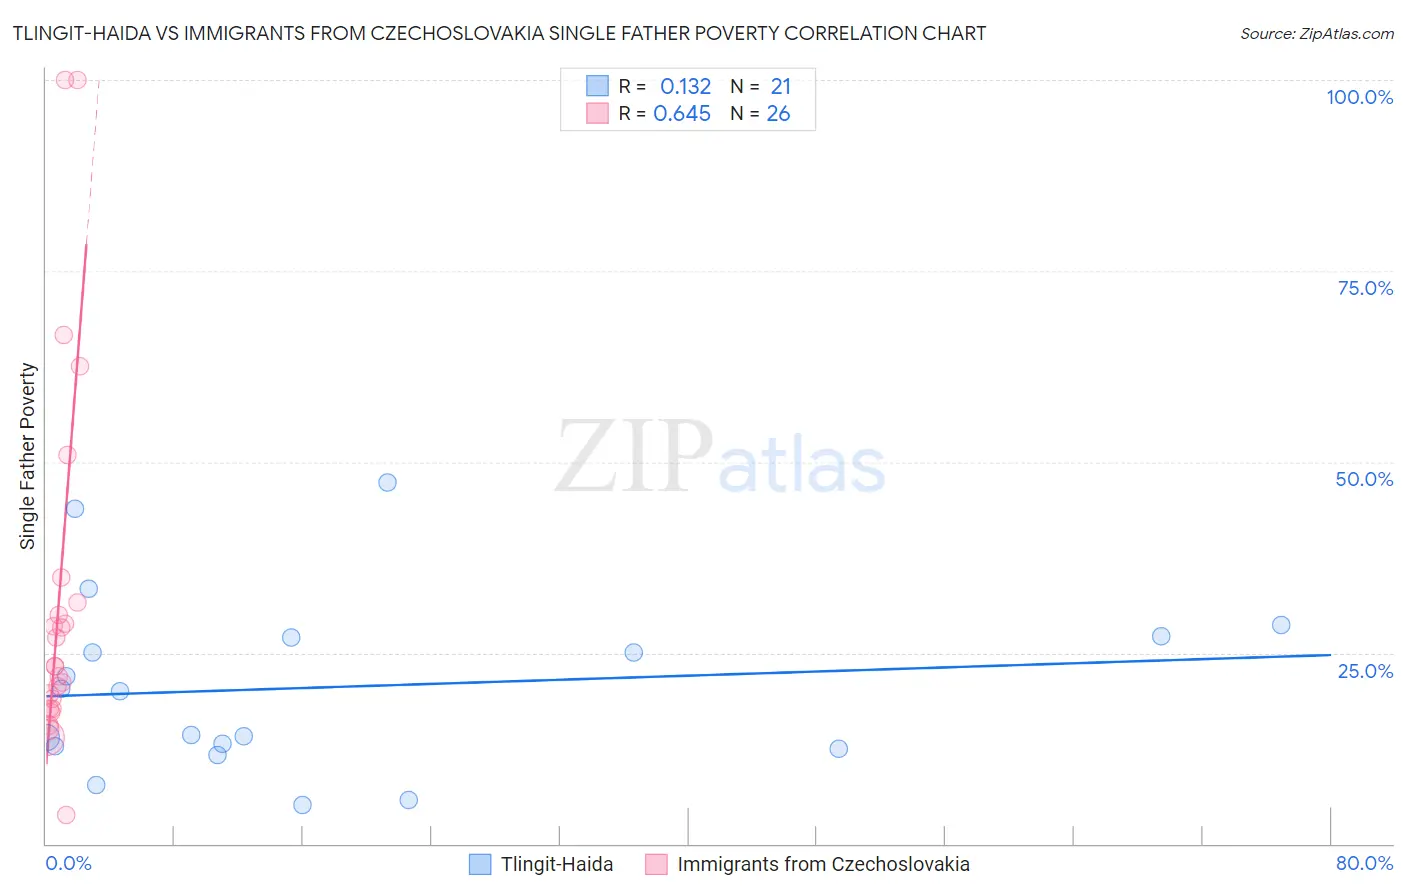
Tlingit-Haida vs Immigrants from Czechoslovakia Single Father Poverty Correlation Chart
The statistical analysis conducted on geographies consisting of 55,978,156 people shows a poor positive correlation between the proportion of Tlingit-Haida and poverty level among single fathers in the United States with a correlation coefficient (R) of 0.132 and weighted average of 15.3%. Similarly, the statistical analysis conducted on geographies consisting of 162,409,027 people shows a significant positive correlation between the proportion of Immigrants from Czechoslovakia and poverty level among single fathers in the United States with a correlation coefficient (R) of 0.645 and weighted average of 16.2%, a difference of 5.6%.
Single Father Poverty Correlation Summary
| Measurement | Tlingit-Haida | Immigrants from Czechoslovakia |
| Minimum | 5.1% | 3.7% |
| Maximum | 47.4% | 100.0% |
| Range | 42.2% | 96.3% |
| Mean | 20.5% | 32.3% |
| Median | 20.0% | 23.3% |
| Interquartile 25% (IQ1) | 12.6% | 17.7% |
| Interquartile 75% (IQ3) | 27.1% | 31.6% |
| Interquartile Range (IQR) | 14.4% | 14.0% |
| Standard Deviation (Sample) | 11.5% | 24.4% |
| Standard Deviation (Population) | 11.2% | 24.0% |
Similar Demographics by Single Father Poverty
Demographics Similar to Tlingit-Haida by Single Father Poverty
In terms of single father poverty, the demographic groups most similar to Tlingit-Haida are Immigrants from Northern Africa (15.3%, a difference of 0.020%), Immigrants from Peru (15.3%, a difference of 0.050%), Immigrants from Japan (15.3%, a difference of 0.060%), Immigrants from Turkey (15.3%, a difference of 0.14%), and Maltese (15.3%, a difference of 0.16%).
| Demographics | Rating | Rank | Single Father Poverty |
| Immigrants | Brazil | 99.6 /100 | #71 | Exceptional 15.3% |
| Immigrants | Lithuania | 99.6 /100 | #72 | Exceptional 15.3% |
| Kenyans | 99.6 /100 | #73 | Exceptional 15.3% |
| Maltese | 99.6 /100 | #74 | Exceptional 15.3% |
| Immigrants | Turkey | 99.5 /100 | #75 | Exceptional 15.3% |
| Immigrants | Japan | 99.5 /100 | #76 | Exceptional 15.3% |
| Immigrants | Peru | 99.5 /100 | #77 | Exceptional 15.3% |
| Tlingit-Haida | 99.5 /100 | #78 | Exceptional 15.3% |
| Immigrants | Northern Africa | 99.5 /100 | #79 | Exceptional 15.3% |
| Armenians | 99.4 /100 | #80 | Exceptional 15.4% |
| Immigrants | Congo | 99.4 /100 | #81 | Exceptional 15.4% |
| Immigrants | Ukraine | 99.4 /100 | #82 | Exceptional 15.4% |
| Chinese | 99.3 /100 | #83 | Exceptional 15.4% |
| Peruvians | 99.2 /100 | #84 | Exceptional 15.4% |
| Immigrants | Oceania | 99.1 /100 | #85 | Exceptional 15.4% |
Demographics Similar to Immigrants from Czechoslovakia by Single Father Poverty
In terms of single father poverty, the demographic groups most similar to Immigrants from Czechoslovakia are Portuguese (16.2%, a difference of 0.020%), Belizean (16.2%, a difference of 0.14%), Immigrants from Sudan (16.2%, a difference of 0.14%), Immigrants from Jordan (16.2%, a difference of 0.16%), and Immigrants from Nicaragua (16.2%, a difference of 0.25%).
| Demographics | Rating | Rank | Single Father Poverty |
| Jordanians | 74.2 /100 | #150 | Good 16.1% |
| Immigrants | France | 73.1 /100 | #151 | Good 16.1% |
| Immigrants | Zimbabwe | 72.1 /100 | #152 | Good 16.1% |
| Immigrants | Israel | 72.0 /100 | #153 | Good 16.1% |
| Mexicans | 70.1 /100 | #154 | Good 16.1% |
| Immigrants | Nicaragua | 67.8 /100 | #155 | Good 16.2% |
| Immigrants | Jordan | 66.0 /100 | #156 | Good 16.2% |
| Immigrants | Czechoslovakia | 62.8 /100 | #157 | Good 16.2% |
| Portuguese | 62.3 /100 | #158 | Good 16.2% |
| Belizeans | 59.9 /100 | #159 | Average 16.2% |
| Immigrants | Sudan | 59.8 /100 | #160 | Average 16.2% |
| Estonians | 56.7 /100 | #161 | Average 16.2% |
| Ugandans | 55.9 /100 | #162 | Average 16.3% |
| Immigrants | Costa Rica | 55.7 /100 | #163 | Average 16.3% |
| Guyanese | 55.2 /100 | #164 | Average 16.3% |