Tongan vs Vietnamese Single Father Poverty
COMPARE
Tongan
Vietnamese
Single Father Poverty
Single Father Poverty Comparison
Tongans
Vietnamese
12.2%
SINGLE FATHER POVERTY
100.0/ 100
METRIC RATING
2nd/ 347
METRIC RANK
16.3%
SINGLE FATHER POVERTY
48.0/ 100
METRIC RATING
176th/ 347
METRIC RANK
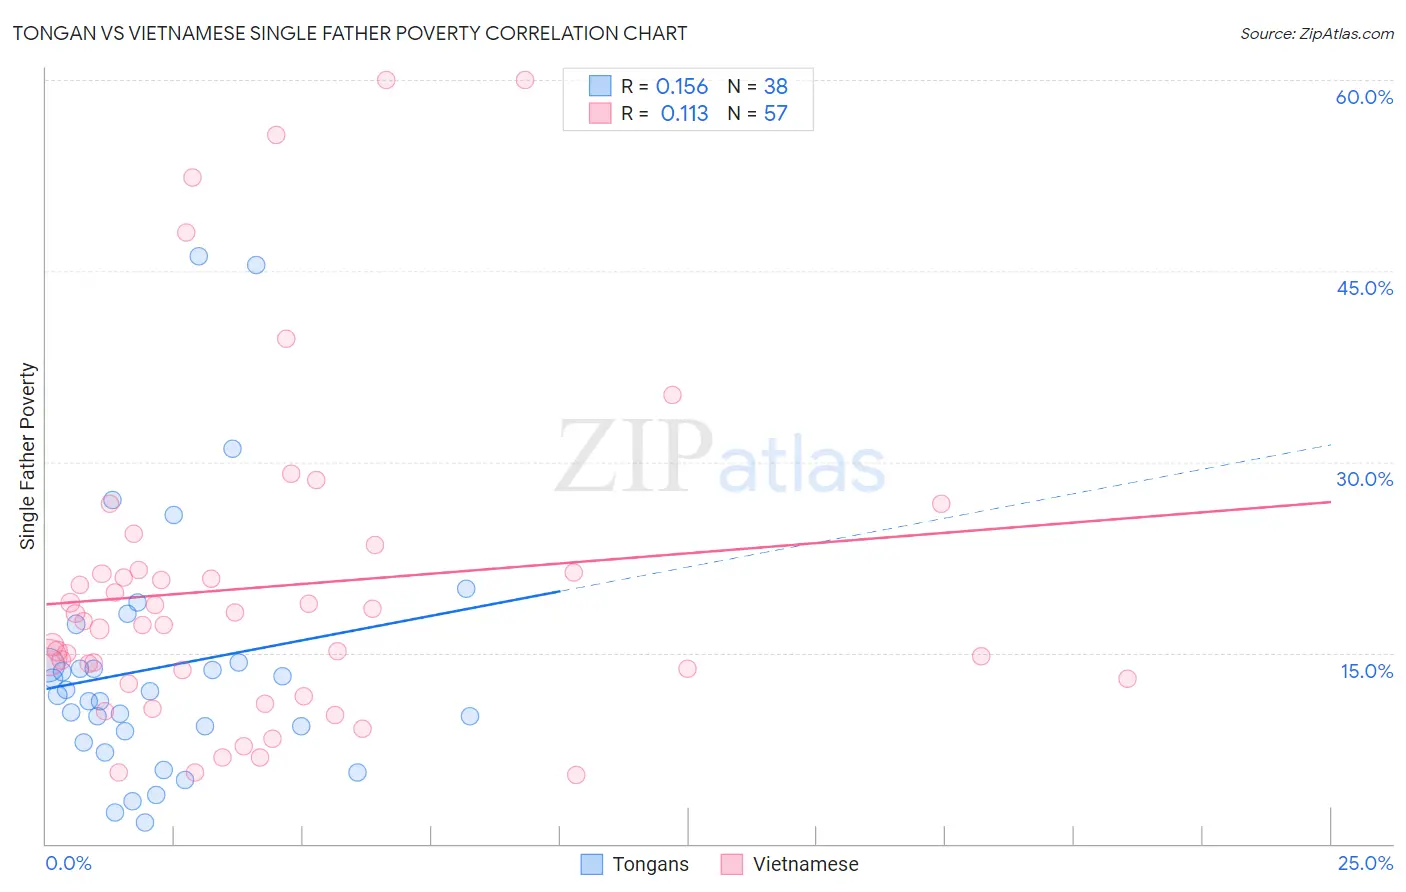
Tongan vs Vietnamese Single Father Poverty Correlation Chart
The statistical analysis conducted on geographies consisting of 92,788,841 people shows a poor positive correlation between the proportion of Tongans and poverty level among single fathers in the United States with a correlation coefficient (R) of 0.156 and weighted average of 12.2%. Similarly, the statistical analysis conducted on geographies consisting of 147,063,845 people shows a poor positive correlation between the proportion of Vietnamese and poverty level among single fathers in the United States with a correlation coefficient (R) of 0.113 and weighted average of 16.3%, a difference of 33.5%.
Single Father Poverty Correlation Summary
| Measurement | Tongan | Vietnamese |
| Minimum | 1.7% | 5.4% |
| Maximum | 46.2% | 60.0% |
| Range | 44.4% | 54.6% |
| Mean | 13.9% | 20.2% |
| Median | 11.8% | 17.2% |
| Interquartile 25% (IQ1) | 8.8% | 12.7% |
| Interquartile 75% (IQ3) | 14.3% | 21.4% |
| Interquartile Range (IQR) | 5.5% | 8.6% |
| Standard Deviation (Sample) | 10.0% | 13.0% |
| Standard Deviation (Population) | 9.8% | 12.9% |
Similar Demographics by Single Father Poverty
Demographics Similar to Tongans by Single Father Poverty
In terms of single father poverty, the demographic groups most similar to Tongans are Tsimshian (12.7%, a difference of 3.9%), Assyrian/Chaldean/Syriac (11.7%, a difference of 4.2%), Immigrants from Fiji (13.2%, a difference of 8.3%), Immigrants from Ethiopia (13.4%, a difference of 10.0%), and Ethiopian (13.5%, a difference of 10.9%).
| Demographics | Rating | Rank | Single Father Poverty |
| Assyrians/Chaldeans/Syriacs | 100.0 /100 | #1 | Exceptional 11.7% |
| Tongans | 100.0 /100 | #2 | Exceptional 12.2% |
| Tsimshian | 100.0 /100 | #3 | Exceptional 12.7% |
| Immigrants | Fiji | 100.0 /100 | #4 | Exceptional 13.2% |
| Immigrants | Ethiopia | 100.0 /100 | #5 | Exceptional 13.4% |
| Ethiopians | 100.0 /100 | #6 | Exceptional 13.5% |
| Immigrants | Taiwan | 100.0 /100 | #7 | Exceptional 13.7% |
| Samoans | 100.0 /100 | #8 | Exceptional 13.8% |
| Afghans | 100.0 /100 | #9 | Exceptional 14.0% |
| Koreans | 100.0 /100 | #10 | Exceptional 14.0% |
| Filipinos | 100.0 /100 | #11 | Exceptional 14.0% |
| Immigrants | India | 100.0 /100 | #12 | Exceptional 14.0% |
| Immigrants | Philippines | 100.0 /100 | #13 | Exceptional 14.0% |
| Immigrants | Vietnam | 100.0 /100 | #14 | Exceptional 14.1% |
| Sri Lankans | 100.0 /100 | #15 | Exceptional 14.2% |
Demographics Similar to Vietnamese by Single Father Poverty
In terms of single father poverty, the demographic groups most similar to Vietnamese are Immigrants from Ecuador (16.3%, a difference of 0.070%), Immigrants from Sierra Leone (16.3%, a difference of 0.090%), Immigrants from St. Vincent and the Grenadines (16.3%, a difference of 0.090%), Swedish (16.3%, a difference of 0.090%), and Immigrants from Morocco (16.3%, a difference of 0.12%).
| Demographics | Rating | Rank | Single Father Poverty |
| Northern Europeans | 52.8 /100 | #169 | Average 16.3% |
| Scandinavians | 52.3 /100 | #170 | Average 16.3% |
| Immigrants | Morocco | 50.7 /100 | #171 | Average 16.3% |
| Immigrants | Sierra Leone | 50.1 /100 | #172 | Average 16.3% |
| Immigrants | St. Vincent and the Grenadines | 50.0 /100 | #173 | Average 16.3% |
| Swedes | 50.0 /100 | #174 | Average 16.3% |
| Immigrants | Ecuador | 49.7 /100 | #175 | Average 16.3% |
| Vietnamese | 48.0 /100 | #176 | Average 16.3% |
| Immigrants | South Africa | 44.2 /100 | #177 | Average 16.3% |
| Immigrants | Cuba | 41.6 /100 | #178 | Average 16.4% |
| Serbians | 40.9 /100 | #179 | Average 16.4% |
| Immigrants | Latin America | 37.2 /100 | #180 | Fair 16.4% |
| Immigrants | Western Africa | 36.0 /100 | #181 | Fair 16.4% |
| Immigrants | Italy | 35.7 /100 | #182 | Fair 16.4% |
| Aleuts | 35.3 /100 | #183 | Fair 16.4% |