Iroquois vs South African Married-Couple Family Poverty
COMPARE
Iroquois
South African
Married-Couple Family Poverty
Married-Couple Family Poverty Comparison
Iroquois
South Africans
5.5%
MARRIED-COUPLE FAMILY POVERTY
13.1/ 100
METRIC RATING
214th/ 347
METRIC RANK
4.6%
MARRIED-COUPLE FAMILY POVERTY
98.7/ 100
METRIC RATING
85th/ 347
METRIC RANK
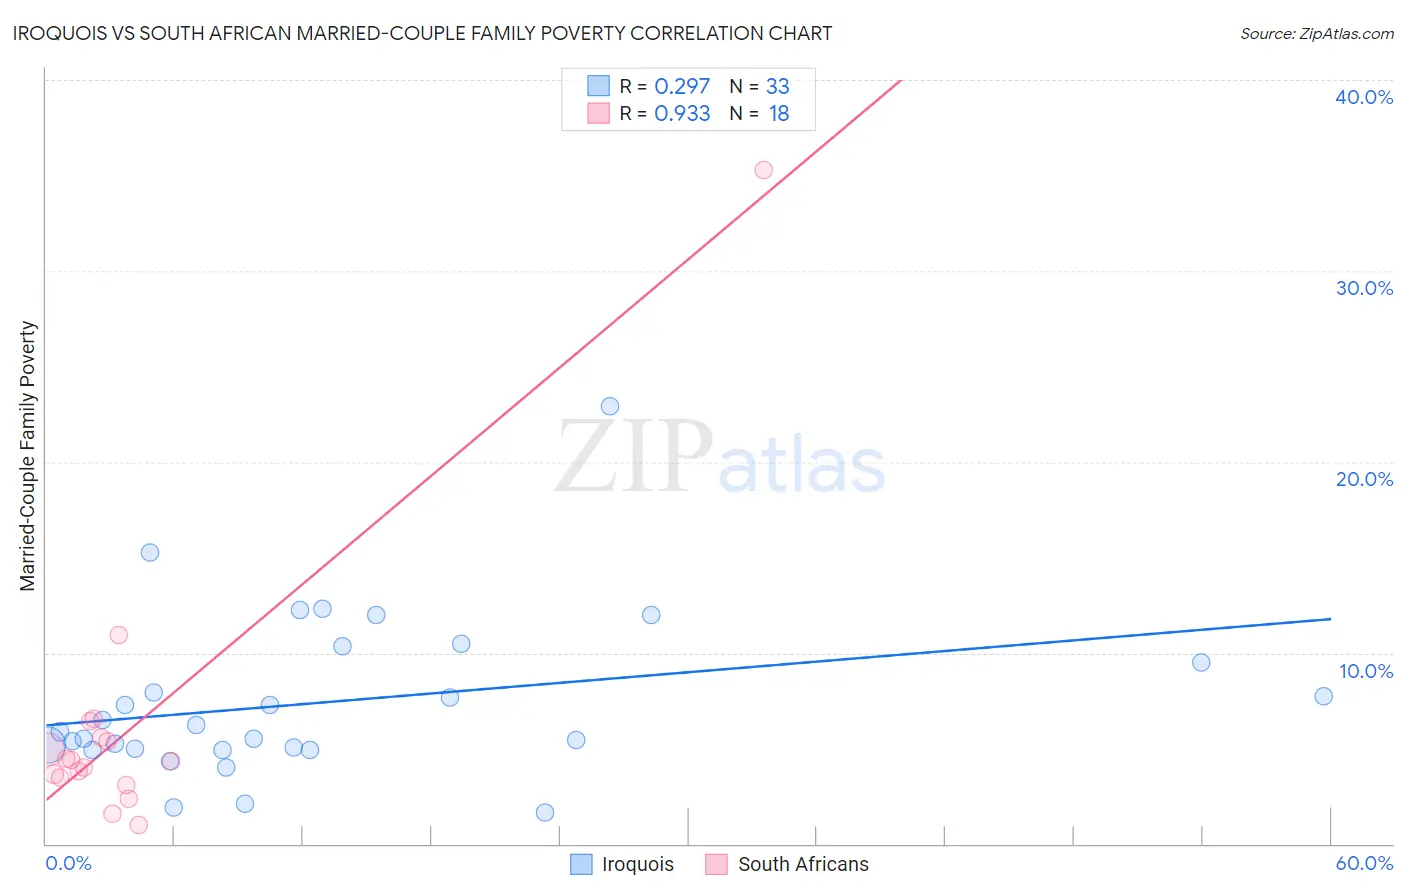
Iroquois vs South African Married-Couple Family Poverty Correlation Chart
The statistical analysis conducted on geographies consisting of 206,259,155 people shows a weak positive correlation between the proportion of Iroquois and poverty level among married-couple families in the United States with a correlation coefficient (R) of 0.297 and weighted average of 5.5%. Similarly, the statistical analysis conducted on geographies consisting of 181,779,474 people shows a near-perfect positive correlation between the proportion of South Africans and poverty level among married-couple families in the United States with a correlation coefficient (R) of 0.933 and weighted average of 4.6%, a difference of 20.5%.
Married-Couple Family Poverty Correlation Summary
| Measurement | Iroquois | South African |
| Minimum | 1.6% | 1.00% |
| Maximum | 22.9% | 35.3% |
| Range | 21.3% | 34.3% |
| Mean | 7.4% | 6.2% |
| Median | 5.9% | 4.4% |
| Interquartile 25% (IQ1) | 4.9% | 3.5% |
| Interquartile 75% (IQ3) | 9.9% | 5.5% |
| Interquartile Range (IQR) | 5.0% | 2.1% |
| Standard Deviation (Sample) | 4.3% | 7.6% |
| Standard Deviation (Population) | 4.2% | 7.4% |
Similar Demographics by Married-Couple Family Poverty
Demographics Similar to Iroquois by Married-Couple Family Poverty
In terms of married-couple family poverty, the demographic groups most similar to Iroquois are Immigrants from Liberia (5.5%, a difference of 0.040%), Armenian (5.5%, a difference of 0.060%), Potawatomi (5.5%, a difference of 0.18%), Immigrants from Thailand (5.5%, a difference of 0.22%), and Nigerian (5.5%, a difference of 0.29%).
| Demographics | Rating | Rank | Married-Couple Family Poverty |
| Immigrants | Africa | 17.6 /100 | #207 | Poor 5.5% |
| French American Indians | 16.1 /100 | #208 | Poor 5.5% |
| Immigrants | Syria | 15.4 /100 | #209 | Poor 5.5% |
| Immigrants | Micronesia | 14.4 /100 | #210 | Poor 5.5% |
| Nigerians | 14.3 /100 | #211 | Poor 5.5% |
| Immigrants | Thailand | 14.0 /100 | #212 | Poor 5.5% |
| Immigrants | Liberia | 13.3 /100 | #213 | Poor 5.5% |
| Iroquois | 13.1 /100 | #214 | Poor 5.5% |
| Armenians | 12.8 /100 | #215 | Poor 5.5% |
| Potawatomi | 12.4 /100 | #216 | Poor 5.5% |
| Immigrants | Nigeria | 11.3 /100 | #217 | Poor 5.5% |
| Afghans | 11.2 /100 | #218 | Poor 5.5% |
| Japanese | 9.8 /100 | #219 | Tragic 5.6% |
| Colombians | 9.2 /100 | #220 | Tragic 5.6% |
| Panamanians | 9.2 /100 | #221 | Tragic 5.6% |
Demographics Similar to South Africans by Married-Couple Family Poverty
In terms of married-couple family poverty, the demographic groups most similar to South Africans are Immigrants from Turkey (4.6%, a difference of 0.040%), Immigrants from North Macedonia (4.6%, a difference of 0.12%), Bolivian (4.6%, a difference of 0.22%), Immigrants from Croatia (4.6%, a difference of 0.23%), and Immigrants from Czechoslovakia (4.6%, a difference of 0.33%).
| Demographics | Rating | Rank | Married-Couple Family Poverty |
| Scotch-Irish | 99.1 /100 | #78 | Exceptional 4.5% |
| Immigrants | Iran | 99.0 /100 | #79 | Exceptional 4.5% |
| Icelanders | 99.0 /100 | #80 | Exceptional 4.5% |
| Immigrants | Greece | 98.9 /100 | #81 | Exceptional 4.5% |
| Canadians | 98.8 /100 | #82 | Exceptional 4.5% |
| Immigrants | Denmark | 98.8 /100 | #83 | Exceptional 4.6% |
| Immigrants | Croatia | 98.7 /100 | #84 | Exceptional 4.6% |
| South Africans | 98.7 /100 | #85 | Exceptional 4.6% |
| Immigrants | Turkey | 98.6 /100 | #86 | Exceptional 4.6% |
| Immigrants | North Macedonia | 98.6 /100 | #87 | Exceptional 4.6% |
| Bolivians | 98.6 /100 | #88 | Exceptional 4.6% |
| Immigrants | Czechoslovakia | 98.5 /100 | #89 | Exceptional 4.6% |
| Immigrants | Switzerland | 98.5 /100 | #90 | Exceptional 4.6% |
| Basques | 98.5 /100 | #91 | Exceptional 4.6% |
| Immigrants | Norway | 98.4 /100 | #92 | Exceptional 4.6% |