Swedish vs South African Vision Disability
COMPARE
Swedish
South African
Vision Disability
Vision Disability Comparison
Swedes
South Africans
2.1%
VISION DISABILITY
94.2/ 100
METRIC RATING
106th/ 347
METRIC RANK
2.1%
VISION DISABILITY
69.8/ 100
METRIC RATING
159th/ 347
METRIC RANK
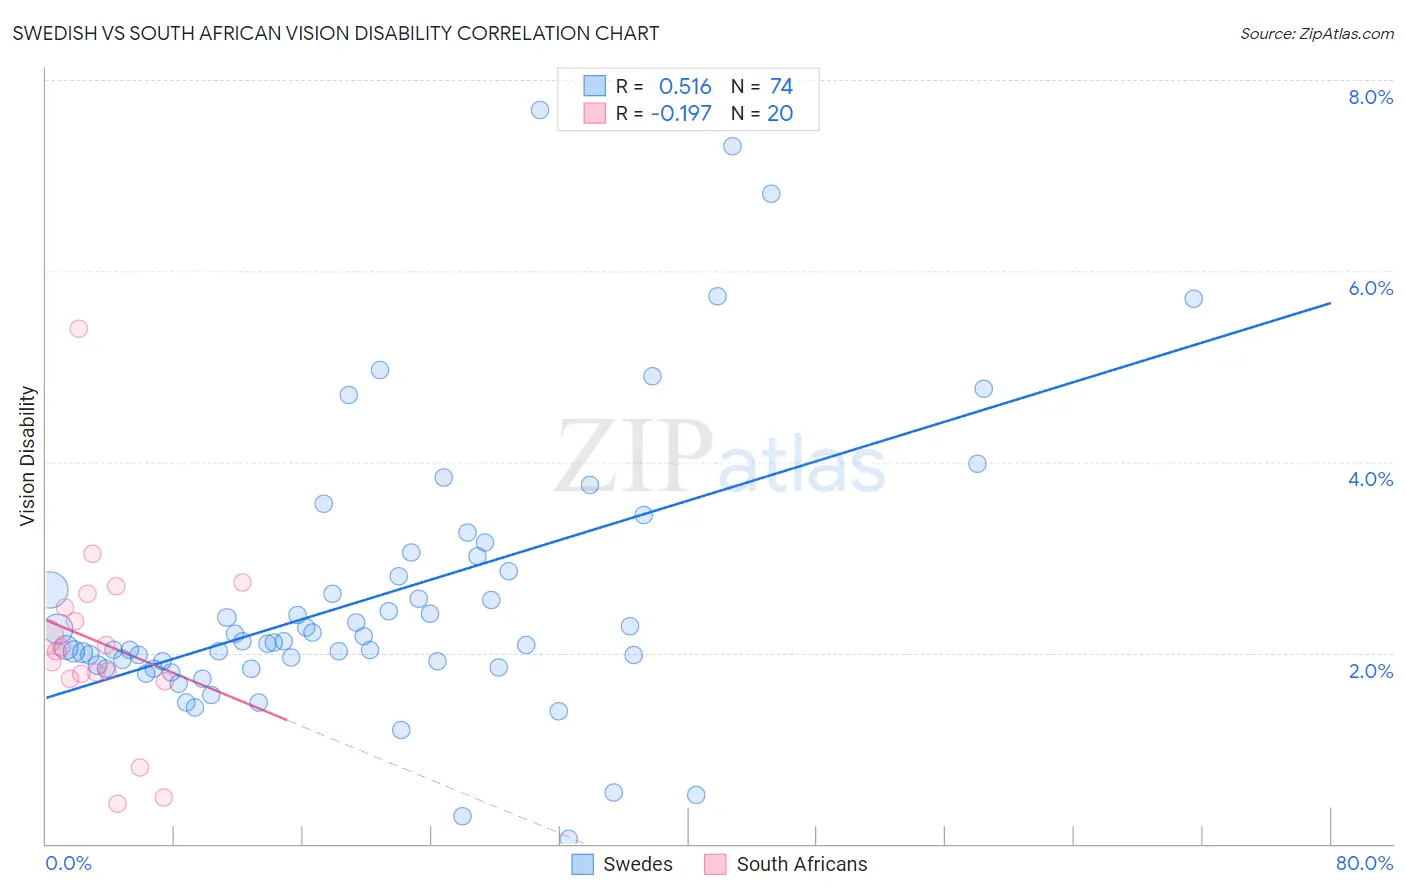
Swedish vs South African Vision Disability Correlation Chart
The statistical analysis conducted on geographies consisting of 537,778,731 people shows a substantial positive correlation between the proportion of Swedes and percentage of population with vision disability in the United States with a correlation coefficient (R) of 0.516 and weighted average of 2.1%. Similarly, the statistical analysis conducted on geographies consisting of 182,556,547 people shows a poor negative correlation between the proportion of South Africans and percentage of population with vision disability in the United States with a correlation coefficient (R) of -0.197 and weighted average of 2.1%, a difference of 3.2%.
Vision Disability Correlation Summary
| Measurement | Swedish | South African |
| Minimum | 0.053% | 0.42% |
| Maximum | 7.7% | 5.4% |
| Range | 7.6% | 5.0% |
| Mean | 2.6% | 2.1% |
| Median | 2.1% | 2.0% |
| Interquartile 25% (IQ1) | 1.9% | 1.8% |
| Interquartile 75% (IQ3) | 2.9% | 2.6% |
| Interquartile Range (IQR) | 0.99% | 0.79% |
| Standard Deviation (Sample) | 1.5% | 1.0% |
| Standard Deviation (Population) | 1.4% | 1.0% |
Similar Demographics by Vision Disability
Demographics Similar to Swedes by Vision Disability
In terms of vision disability, the demographic groups most similar to Swedes are Danish (2.1%, a difference of 0.010%), Korean (2.1%, a difference of 0.030%), Carpatho Rusyn (2.1%, a difference of 0.040%), Chilean (2.1%, a difference of 0.050%), and Immigrants from Italy (2.1%, a difference of 0.060%).
| Demographics | Rating | Rank | Vision Disability |
| Estonians | 95.3 /100 | #99 | Exceptional 2.1% |
| Greeks | 95.1 /100 | #100 | Exceptional 2.1% |
| Albanians | 94.9 /100 | #101 | Exceptional 2.1% |
| Sri Lankans | 94.8 /100 | #102 | Exceptional 2.1% |
| Immigrants | Austria | 94.4 /100 | #103 | Exceptional 2.1% |
| Immigrants | Italy | 94.4 /100 | #104 | Exceptional 2.1% |
| Carpatho Rusyns | 94.3 /100 | #105 | Exceptional 2.1% |
| Swedes | 94.2 /100 | #106 | Exceptional 2.1% |
| Danes | 94.2 /100 | #107 | Exceptional 2.1% |
| Koreans | 94.1 /100 | #108 | Exceptional 2.1% |
| Chileans | 94.0 /100 | #109 | Exceptional 2.1% |
| Immigrants | Armenia | 93.8 /100 | #110 | Exceptional 2.1% |
| Peruvians | 93.5 /100 | #111 | Exceptional 2.1% |
| Immigrants | Denmark | 92.9 /100 | #112 | Exceptional 2.1% |
| Kenyans | 92.5 /100 | #113 | Exceptional 2.1% |
Demographics Similar to South Africans by Vision Disability
In terms of vision disability, the demographic groups most similar to South Africans are Immigrants from Uzbekistan (2.1%, a difference of 0.010%), Serbian (2.1%, a difference of 0.030%), Austrian (2.1%, a difference of 0.060%), Pakistani (2.1%, a difference of 0.14%), and Iraqi (2.1%, a difference of 0.15%).
| Demographics | Rating | Rank | Vision Disability |
| Immigrants | Southern Europe | 74.6 /100 | #152 | Good 2.1% |
| Immigrants | South America | 73.8 /100 | #153 | Good 2.1% |
| Slovenes | 73.6 /100 | #154 | Good 2.1% |
| Immigrants | Colombia | 72.1 /100 | #155 | Good 2.1% |
| Pakistanis | 71.6 /100 | #156 | Good 2.1% |
| Serbians | 70.2 /100 | #157 | Good 2.1% |
| Immigrants | Uzbekistan | 69.9 /100 | #158 | Good 2.1% |
| South Africans | 69.8 /100 | #159 | Good 2.1% |
| Austrians | 69.0 /100 | #160 | Good 2.1% |
| Iraqis | 67.7 /100 | #161 | Good 2.1% |
| Hungarians | 67.4 /100 | #162 | Good 2.1% |
| Icelanders | 66.1 /100 | #163 | Good 2.1% |
| Immigrants | Bangladesh | 65.5 /100 | #164 | Good 2.1% |
| Immigrants | Iraq | 64.8 /100 | #165 | Good 2.1% |
| Immigrants | England | 62.8 /100 | #166 | Good 2.1% |