Spanish American Indian vs Immigrants from North Macedonia Married-couple Households
COMPARE
Spanish American Indian
Immigrants from North Macedonia
Married-couple Households
Married-couple Households Comparison
Spanish American Indians
Immigrants from North Macedonia
46.6%
MARRIED-COUPLE HOUSEHOLDS
59.4/ 100
METRIC RATING
169th/ 347
METRIC RANK
47.9%
MARRIED-COUPLE HOUSEHOLDS
96.4/ 100
METRIC RATING
98th/ 347
METRIC RANK
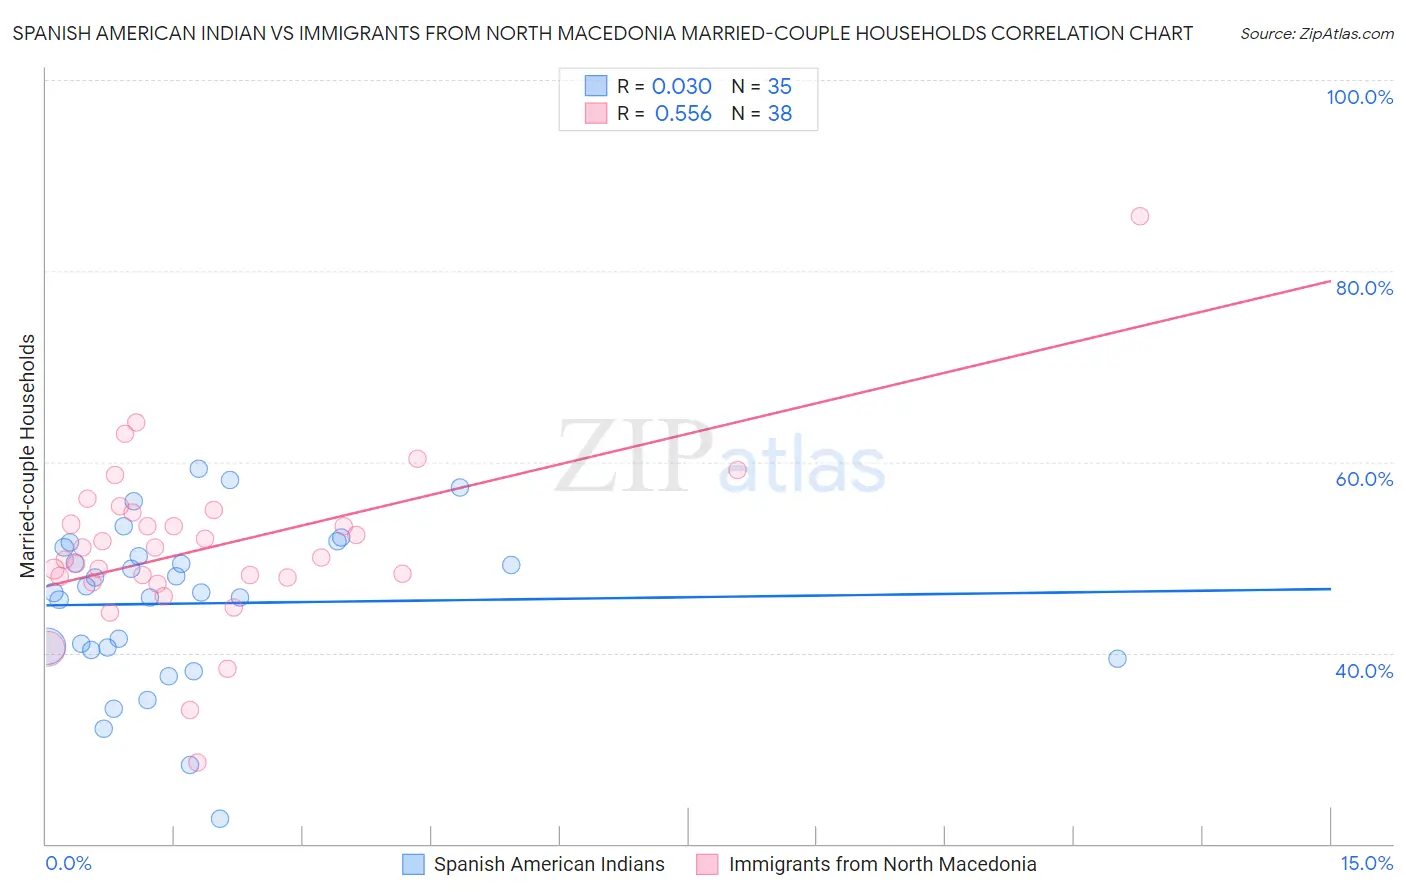
Spanish American Indian vs Immigrants from North Macedonia Married-couple Households Correlation Chart
The statistical analysis conducted on geographies consisting of 73,145,550 people shows no correlation between the proportion of Spanish American Indians and percentage of married-couple family households in the United States with a correlation coefficient (R) of 0.030 and weighted average of 46.6%. Similarly, the statistical analysis conducted on geographies consisting of 74,300,796 people shows a substantial positive correlation between the proportion of Immigrants from North Macedonia and percentage of married-couple family households in the United States with a correlation coefficient (R) of 0.556 and weighted average of 47.9%, a difference of 2.7%.
Married-couple Households Correlation Summary
| Measurement | Spanish American Indian | Immigrants from North Macedonia |
| Minimum | 22.6% | 28.5% |
| Maximum | 59.2% | 85.7% |
| Range | 36.7% | 57.2% |
| Mean | 45.2% | 51.1% |
| Median | 46.3% | 50.5% |
| Interquartile 25% (IQ1) | 40.3% | 47.9% |
| Interquartile 75% (IQ3) | 51.0% | 54.8% |
| Interquartile Range (IQR) | 10.7% | 6.9% |
| Standard Deviation (Sample) | 8.4% | 9.2% |
| Standard Deviation (Population) | 8.3% | 9.0% |
Similar Demographics by Married-couple Households
Demographics Similar to Spanish American Indians by Married-couple Households
In terms of married-couple households, the demographic groups most similar to Spanish American Indians are South American (46.6%, a difference of 0.050%), Israeli (46.7%, a difference of 0.11%), Immigrants from Chile (46.5%, a difference of 0.14%), Immigrants from Australia (46.5%, a difference of 0.18%), and Immigrants from Croatia (46.7%, a difference of 0.19%).
| Demographics | Rating | Rank | Married-couple Households |
| Colombians | 71.0 /100 | #162 | Good 46.8% |
| Immigrants | Turkey | 70.2 /100 | #163 | Good 46.8% |
| Immigrants | Kazakhstan | 70.0 /100 | #164 | Good 46.8% |
| Immigrants | Southern Europe | 69.9 /100 | #165 | Good 46.8% |
| Cherokee | 65.7 /100 | #166 | Good 46.7% |
| Immigrants | Croatia | 64.2 /100 | #167 | Good 46.7% |
| Israelis | 62.3 /100 | #168 | Good 46.7% |
| Spanish American Indians | 59.4 /100 | #169 | Average 46.6% |
| South Americans | 58.0 /100 | #170 | Average 46.6% |
| Immigrants | Chile | 55.7 /100 | #171 | Average 46.5% |
| Immigrants | Australia | 54.6 /100 | #172 | Average 46.5% |
| Immigrants | Norway | 52.0 /100 | #173 | Average 46.5% |
| Immigrants | Mexico | 50.0 /100 | #174 | Average 46.4% |
| Immigrants | Colombia | 46.1 /100 | #175 | Average 46.4% |
| Cajuns | 45.2 /100 | #176 | Average 46.4% |
Demographics Similar to Immigrants from North Macedonia by Married-couple Households
In terms of married-couple households, the demographic groups most similar to Immigrants from North Macedonia are Latvian (47.9%, a difference of 0.010%), Immigrants from Austria (47.9%, a difference of 0.010%), Immigrants from Italy (47.9%, a difference of 0.020%), Immigrants from Egypt (47.9%, a difference of 0.040%), and Turkish (47.8%, a difference of 0.080%).
| Demographics | Rating | Rank | Married-couple Households |
| Immigrants | Moldova | 97.0 /100 | #91 | Exceptional 48.0% |
| Palestinians | 96.9 /100 | #92 | Exceptional 48.0% |
| Lebanese | 96.9 /100 | #93 | Exceptional 47.9% |
| Americans | 96.9 /100 | #94 | Exceptional 47.9% |
| Immigrants | Belgium | 96.8 /100 | #95 | Exceptional 47.9% |
| Immigrants | Egypt | 96.6 /100 | #96 | Exceptional 47.9% |
| Latvians | 96.5 /100 | #97 | Exceptional 47.9% |
| Immigrants | North Macedonia | 96.4 /100 | #98 | Exceptional 47.9% |
| Immigrants | Austria | 96.4 /100 | #99 | Exceptional 47.9% |
| Immigrants | Italy | 96.3 /100 | #100 | Exceptional 47.9% |
| Turks | 96.1 /100 | #101 | Exceptional 47.8% |
| Slavs | 96.0 /100 | #102 | Exceptional 47.8% |
| Hawaiians | 96.0 /100 | #103 | Exceptional 47.8% |
| Immigrants | South Africa | 96.0 /100 | #104 | Exceptional 47.8% |
| Immigrants | Czechoslovakia | 95.5 /100 | #105 | Exceptional 47.8% |