Immigrants from Ecuador vs Immigrants from Venezuela Married-Couple Family Poverty
COMPARE
Immigrants from Ecuador
Immigrants from Venezuela
Married-Couple Family Poverty
Married-Couple Family Poverty Comparison
Immigrants from Ecuador
Immigrants from Venezuela
6.7%
MARRIED-COUPLE FAMILY POVERTY
0.0/ 100
METRIC RATING
302nd/ 347
METRIC RANK
5.8%
MARRIED-COUPLE FAMILY POVERTY
1.8/ 100
METRIC RATING
246th/ 347
METRIC RANK
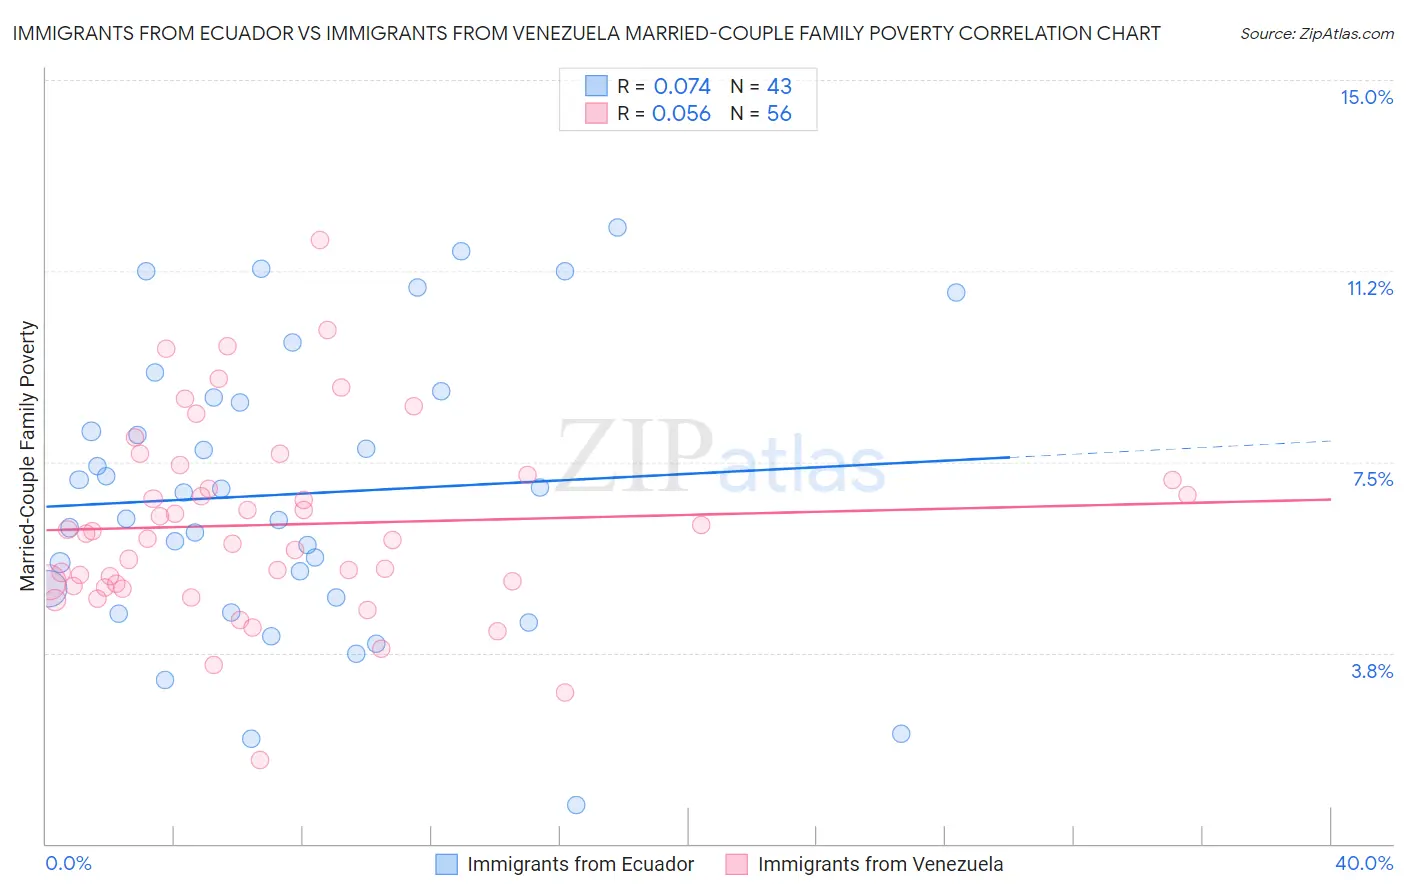
Immigrants from Ecuador vs Immigrants from Venezuela Married-Couple Family Poverty Correlation Chart
The statistical analysis conducted on geographies consisting of 269,492,942 people shows a slight positive correlation between the proportion of Immigrants from Ecuador and poverty level among married-couple families in the United States with a correlation coefficient (R) of 0.074 and weighted average of 6.7%. Similarly, the statistical analysis conducted on geographies consisting of 286,630,688 people shows a slight positive correlation between the proportion of Immigrants from Venezuela and poverty level among married-couple families in the United States with a correlation coefficient (R) of 0.056 and weighted average of 5.8%, a difference of 15.8%.
Married-Couple Family Poverty Correlation Summary
| Measurement | Immigrants from Ecuador | Immigrants from Venezuela |
| Minimum | 0.76% | 1.7% |
| Maximum | 12.1% | 11.8% |
| Range | 11.3% | 10.2% |
| Mean | 6.9% | 6.3% |
| Median | 6.9% | 6.0% |
| Interquartile 25% (IQ1) | 4.8% | 5.1% |
| Interquartile 75% (IQ3) | 8.8% | 7.2% |
| Interquartile Range (IQR) | 3.9% | 2.1% |
| Standard Deviation (Sample) | 2.8% | 1.9% |
| Standard Deviation (Population) | 2.8% | 1.9% |
Similar Demographics by Married-Couple Family Poverty
Demographics Similar to Immigrants from Ecuador by Married-Couple Family Poverty
In terms of married-couple family poverty, the demographic groups most similar to Immigrants from Ecuador are Central American (6.7%, a difference of 0.14%), Immigrants from El Salvador (6.8%, a difference of 0.28%), Cuban (6.8%, a difference of 0.72%), Immigrants from Belize (6.7%, a difference of 0.74%), and Haitian (6.8%, a difference of 0.83%).
| Demographics | Rating | Rank | Married-Couple Family Poverty |
| Immigrants | Uzbekistan | 0.0 /100 | #295 | Tragic 6.6% |
| U.S. Virgin Islanders | 0.0 /100 | #296 | Tragic 6.6% |
| Kiowa | 0.0 /100 | #297 | Tragic 6.6% |
| Immigrants | Guyana | 0.0 /100 | #298 | Tragic 6.7% |
| Nicaraguans | 0.0 /100 | #299 | Tragic 6.7% |
| Immigrants | Belize | 0.0 /100 | #300 | Tragic 6.7% |
| Central Americans | 0.0 /100 | #301 | Tragic 6.7% |
| Immigrants | Ecuador | 0.0 /100 | #302 | Tragic 6.7% |
| Immigrants | El Salvador | 0.0 /100 | #303 | Tragic 6.8% |
| Cubans | 0.0 /100 | #304 | Tragic 6.8% |
| Haitians | 0.0 /100 | #305 | Tragic 6.8% |
| Immigrants | Haiti | 0.0 /100 | #306 | Tragic 7.0% |
| Guatemalans | 0.0 /100 | #307 | Tragic 7.0% |
| Spanish American Indians | 0.0 /100 | #308 | Tragic 7.1% |
| Hopi | 0.0 /100 | #309 | Tragic 7.1% |
Demographics Similar to Immigrants from Venezuela by Married-Couple Family Poverty
In terms of married-couple family poverty, the demographic groups most similar to Immigrants from Venezuela are Immigrants from Afghanistan (5.8%, a difference of 0.52%), Iraqi (5.9%, a difference of 0.62%), Chickasaw (5.8%, a difference of 0.66%), Somali (5.8%, a difference of 0.68%), and Immigrants from Western Africa (5.8%, a difference of 0.83%).
| Demographics | Rating | Rank | Married-Couple Family Poverty |
| Venezuelans | 2.7 /100 | #239 | Tragic 5.8% |
| Fijians | 2.5 /100 | #240 | Tragic 5.8% |
| Immigrants | Panama | 2.5 /100 | #241 | Tragic 5.8% |
| Immigrants | Western Africa | 2.4 /100 | #242 | Tragic 5.8% |
| Somalis | 2.3 /100 | #243 | Tragic 5.8% |
| Chickasaw | 2.3 /100 | #244 | Tragic 5.8% |
| Immigrants | Afghanistan | 2.1 /100 | #245 | Tragic 5.8% |
| Immigrants | Venezuela | 1.8 /100 | #246 | Tragic 5.8% |
| Iraqis | 1.4 /100 | #247 | Tragic 5.9% |
| Cree | 1.2 /100 | #248 | Tragic 5.9% |
| Tsimshian | 1.1 /100 | #249 | Tragic 5.9% |
| Immigrants | Eritrea | 1.1 /100 | #250 | Tragic 5.9% |
| Immigrants | Ghana | 1.0 /100 | #251 | Tragic 5.9% |
| Immigrants | Western Asia | 0.7 /100 | #252 | Tragic 6.0% |
| Africans | 0.7 /100 | #253 | Tragic 6.0% |