Scottish vs Trinidadian and Tobagonian Male Poverty
COMPARE
Scottish
Trinidadian and Tobagonian
Male Poverty
Male Poverty Comparison
Scottish
Trinidadians and Tobagonians
10.4%
MALE POVERTY
94.0/ 100
METRIC RATING
95th/ 347
METRIC RANK
13.1%
MALE POVERTY
0.1/ 100
METRIC RATING
261st/ 347
METRIC RANK
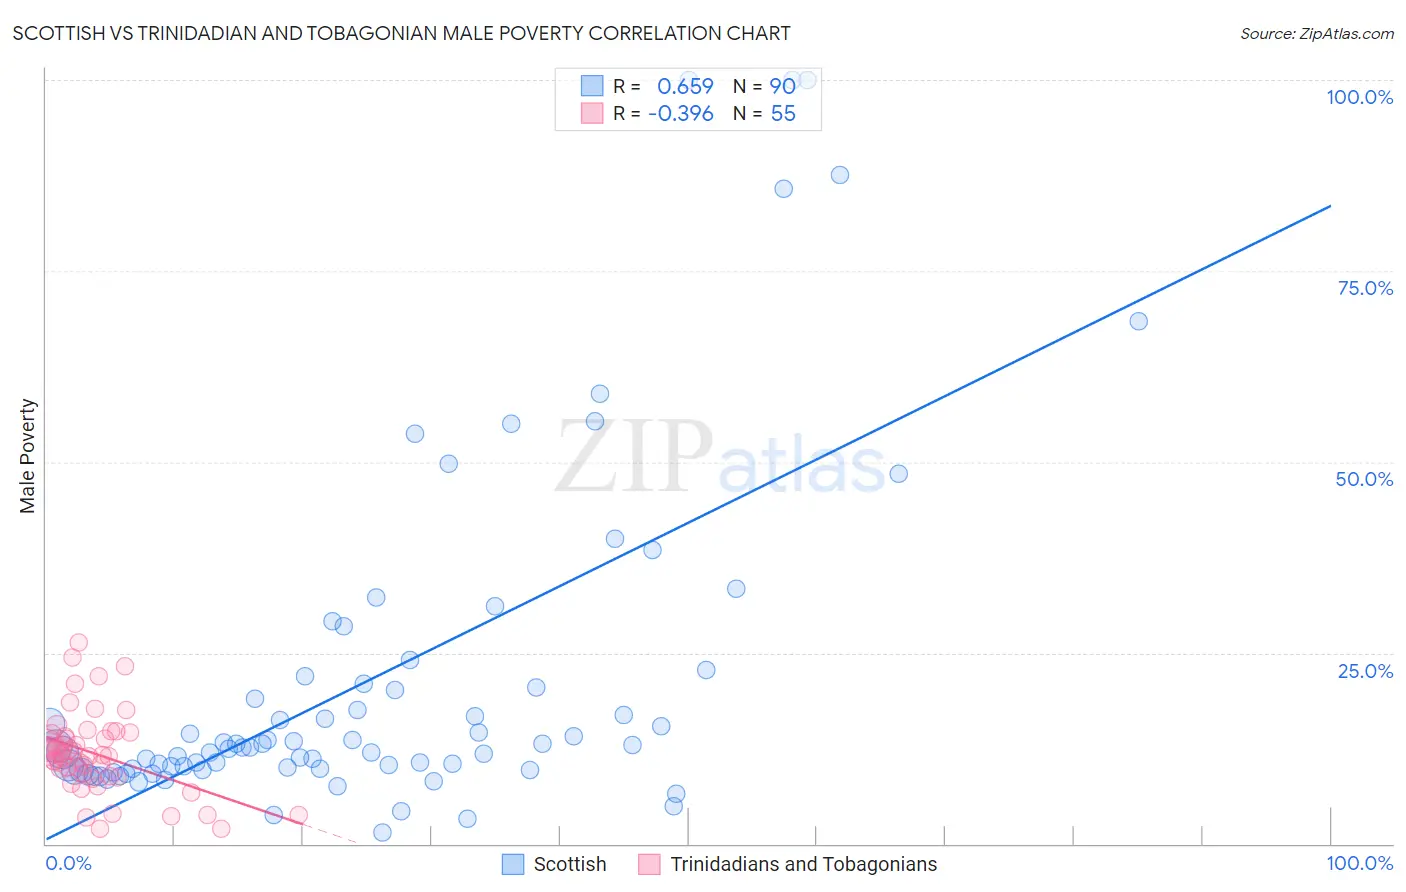
Scottish vs Trinidadian and Tobagonian Male Poverty Correlation Chart
The statistical analysis conducted on geographies consisting of 565,490,793 people shows a significant positive correlation between the proportion of Scottish and poverty level among males in the United States with a correlation coefficient (R) of 0.659 and weighted average of 10.4%. Similarly, the statistical analysis conducted on geographies consisting of 219,673,525 people shows a mild negative correlation between the proportion of Trinidadians and Tobagonians and poverty level among males in the United States with a correlation coefficient (R) of -0.396 and weighted average of 13.1%, a difference of 25.6%.
Male Poverty Correlation Summary
| Measurement | Scottish | Trinidadian and Tobagonian |
| Minimum | 1.5% | 2.0% |
| Maximum | 100.0% | 26.4% |
| Range | 98.5% | 24.4% |
| Mean | 21.6% | 11.9% |
| Median | 12.7% | 11.7% |
| Interquartile 25% (IQ1) | 9.8% | 8.9% |
| Interquartile 75% (IQ3) | 20.9% | 14.4% |
| Interquartile Range (IQR) | 11.1% | 5.5% |
| Standard Deviation (Sample) | 22.3% | 5.3% |
| Standard Deviation (Population) | 22.2% | 5.3% |
Similar Demographics by Male Poverty
Demographics Similar to Scottish by Male Poverty
In terms of male poverty, the demographic groups most similar to Scottish are Immigrants from South Africa (10.4%, a difference of 0.030%), Immigrants from Egypt (10.4%, a difference of 0.13%), Romanian (10.5%, a difference of 0.18%), Australian (10.4%, a difference of 0.20%), and Jordanian (10.4%, a difference of 0.21%).
| Demographics | Rating | Rank | Male Poverty |
| Cambodians | 95.0 /100 | #88 | Exceptional 10.4% |
| Immigrants | Denmark | 95.0 /100 | #89 | Exceptional 10.4% |
| Indians (Asian) | 94.9 /100 | #90 | Exceptional 10.4% |
| British | 94.8 /100 | #91 | Exceptional 10.4% |
| Jordanians | 94.4 /100 | #92 | Exceptional 10.4% |
| Australians | 94.4 /100 | #93 | Exceptional 10.4% |
| Immigrants | South Africa | 94.1 /100 | #94 | Exceptional 10.4% |
| Scottish | 94.0 /100 | #95 | Exceptional 10.4% |
| Immigrants | Egypt | 93.7 /100 | #96 | Exceptional 10.4% |
| Romanians | 93.6 /100 | #97 | Exceptional 10.5% |
| Finns | 93.4 /100 | #98 | Exceptional 10.5% |
| Immigrants | Indonesia | 93.3 /100 | #99 | Exceptional 10.5% |
| Immigrants | Latvia | 92.8 /100 | #100 | Exceptional 10.5% |
| Immigrants | Zimbabwe | 92.0 /100 | #101 | Exceptional 10.5% |
| French Canadians | 91.9 /100 | #102 | Exceptional 10.5% |
Demographics Similar to Trinidadians and Tobagonians by Male Poverty
In terms of male poverty, the demographic groups most similar to Trinidadians and Tobagonians are Ottawa (13.1%, a difference of 0.020%), Spanish American Indian (13.1%, a difference of 0.050%), Cherokee (13.1%, a difference of 0.13%), Cape Verdean (13.1%, a difference of 0.30%), and Immigrants from Trinidad and Tobago (13.1%, a difference of 0.42%).
| Demographics | Rating | Rank | Male Poverty |
| Mexican American Indians | 0.1 /100 | #254 | Tragic 13.0% |
| Immigrants | Liberia | 0.1 /100 | #255 | Tragic 13.0% |
| Immigrants | Burma/Myanmar | 0.1 /100 | #256 | Tragic 13.0% |
| Immigrants | Trinidad and Tobago | 0.1 /100 | #257 | Tragic 13.1% |
| Cape Verdeans | 0.1 /100 | #258 | Tragic 13.1% |
| Cherokee | 0.1 /100 | #259 | Tragic 13.1% |
| Ottawa | 0.1 /100 | #260 | Tragic 13.1% |
| Trinidadians and Tobagonians | 0.1 /100 | #261 | Tragic 13.1% |
| Spanish American Indians | 0.1 /100 | #262 | Tragic 13.1% |
| Central Americans | 0.1 /100 | #263 | Tragic 13.2% |
| Iroquois | 0.1 /100 | #264 | Tragic 13.2% |
| Jamaicans | 0.1 /100 | #265 | Tragic 13.2% |
| Immigrants | Guyana | 0.1 /100 | #266 | Tragic 13.2% |
| Immigrants | Jamaica | 0.1 /100 | #267 | Tragic 13.3% |
| Sub-Saharan Africans | 0.1 /100 | #268 | Tragic 13.3% |