Scottish vs Immigrants from Venezuela Family Poverty
COMPARE
Scottish
Immigrants from Venezuela
Family Poverty
Family Poverty Comparison
Scottish
Immigrants from Venezuela
7.9%
FAMILY POVERTY
97.3/ 100
METRIC RATING
86th/ 347
METRIC RANK
9.3%
FAMILY POVERTY
26.1/ 100
METRIC RATING
196th/ 347
METRIC RANK
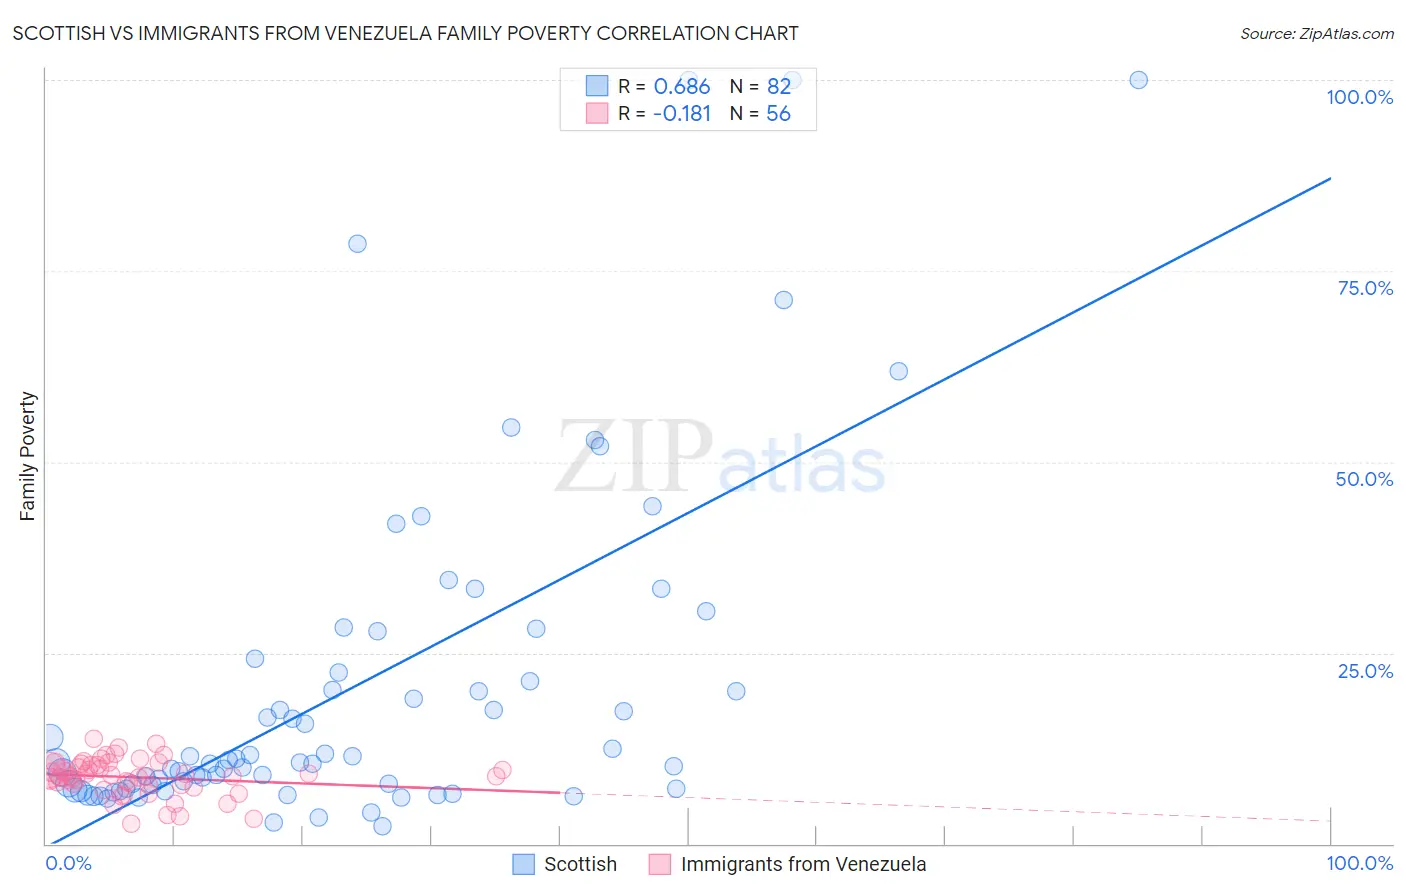
Scottish vs Immigrants from Venezuela Family Poverty Correlation Chart
The statistical analysis conducted on geographies consisting of 562,331,846 people shows a significant positive correlation between the proportion of Scottish and poverty level among families in the United States with a correlation coefficient (R) of 0.686 and weighted average of 7.9%. Similarly, the statistical analysis conducted on geographies consisting of 287,460,652 people shows a poor negative correlation between the proportion of Immigrants from Venezuela and poverty level among families in the United States with a correlation coefficient (R) of -0.181 and weighted average of 9.3%, a difference of 17.2%.
Family Poverty Correlation Summary
| Measurement | Scottish | Immigrants from Venezuela |
| Minimum | 2.3% | 2.6% |
| Maximum | 100.0% | 13.7% |
| Range | 97.7% | 11.1% |
| Mean | 20.4% | 8.7% |
| Median | 10.7% | 8.9% |
| Interquartile 25% (IQ1) | 7.2% | 7.7% |
| Interquartile 75% (IQ3) | 22.4% | 10.3% |
| Interquartile Range (IQR) | 15.2% | 2.7% |
| Standard Deviation (Sample) | 22.2% | 2.4% |
| Standard Deviation (Population) | 22.1% | 2.4% |
Similar Demographics by Family Poverty
Demographics Similar to Scottish by Family Poverty
In terms of family poverty, the demographic groups most similar to Scottish are Immigrants from Asia (7.9%, a difference of 0.040%), Belgian (8.0%, a difference of 0.090%), Serbian (8.0%, a difference of 0.15%), British (7.9%, a difference of 0.29%), and Immigrants from Denmark (8.0%, a difference of 0.30%).
| Demographics | Rating | Rank | Family Poverty |
| Immigrants | Europe | 97.8 /100 | #79 | Exceptional 7.9% |
| English | 97.8 /100 | #80 | Exceptional 7.9% |
| Irish | 97.8 /100 | #81 | Exceptional 7.9% |
| Immigrants | Poland | 97.8 /100 | #82 | Exceptional 7.9% |
| Slovaks | 97.7 /100 | #83 | Exceptional 7.9% |
| British | 97.5 /100 | #84 | Exceptional 7.9% |
| Immigrants | Asia | 97.4 /100 | #85 | Exceptional 7.9% |
| Scottish | 97.3 /100 | #86 | Exceptional 7.9% |
| Belgians | 97.3 /100 | #87 | Exceptional 8.0% |
| Serbians | 97.2 /100 | #88 | Exceptional 8.0% |
| Immigrants | Denmark | 97.1 /100 | #89 | Exceptional 8.0% |
| Immigrants | England | 97.1 /100 | #90 | Exceptional 8.0% |
| Immigrants | Italy | 97.0 /100 | #91 | Exceptional 8.0% |
| Czechoslovakians | 96.8 /100 | #92 | Exceptional 8.0% |
| Tlingit-Haida | 96.7 /100 | #93 | Exceptional 8.0% |
Demographics Similar to Immigrants from Venezuela by Family Poverty
In terms of family poverty, the demographic groups most similar to Immigrants from Venezuela are Venezuelan (9.3%, a difference of 0.21%), Immigrants from Colombia (9.3%, a difference of 0.29%), Iraqi (9.3%, a difference of 0.32%), South American (9.3%, a difference of 0.33%), and Immigrants from Western Asia (9.3%, a difference of 0.34%).
| Demographics | Rating | Rank | Family Poverty |
| Immigrants | Afghanistan | 32.1 /100 | #189 | Fair 9.2% |
| Arabs | 31.5 /100 | #190 | Fair 9.2% |
| Ugandans | 28.7 /100 | #191 | Fair 9.3% |
| Spanish | 28.7 /100 | #192 | Fair 9.3% |
| Immigrants | Western Asia | 28.2 /100 | #193 | Fair 9.3% |
| South Americans | 28.1 /100 | #194 | Fair 9.3% |
| Venezuelans | 27.4 /100 | #195 | Fair 9.3% |
| Immigrants | Venezuela | 26.1 /100 | #196 | Fair 9.3% |
| Immigrants | Colombia | 24.4 /100 | #197 | Fair 9.3% |
| Iraqis | 24.2 /100 | #198 | Fair 9.3% |
| Spaniards | 22.8 /100 | #199 | Fair 9.4% |
| Immigrants | Costa Rica | 21.7 /100 | #200 | Fair 9.4% |
| Immigrants | Portugal | 20.5 /100 | #201 | Fair 9.4% |
| Immigrants | Sierra Leone | 19.6 /100 | #202 | Poor 9.4% |
| German Russians | 19.4 /100 | #203 | Poor 9.4% |