Scottish vs Immigrants from Congo Family Poverty
COMPARE
Scottish
Immigrants from Congo
Family Poverty
Family Poverty Comparison
Scottish
Immigrants from Congo
7.9%
FAMILY POVERTY
97.3/ 100
METRIC RATING
86th/ 347
METRIC RANK
11.9%
FAMILY POVERTY
0.0/ 100
METRIC RATING
307th/ 347
METRIC RANK
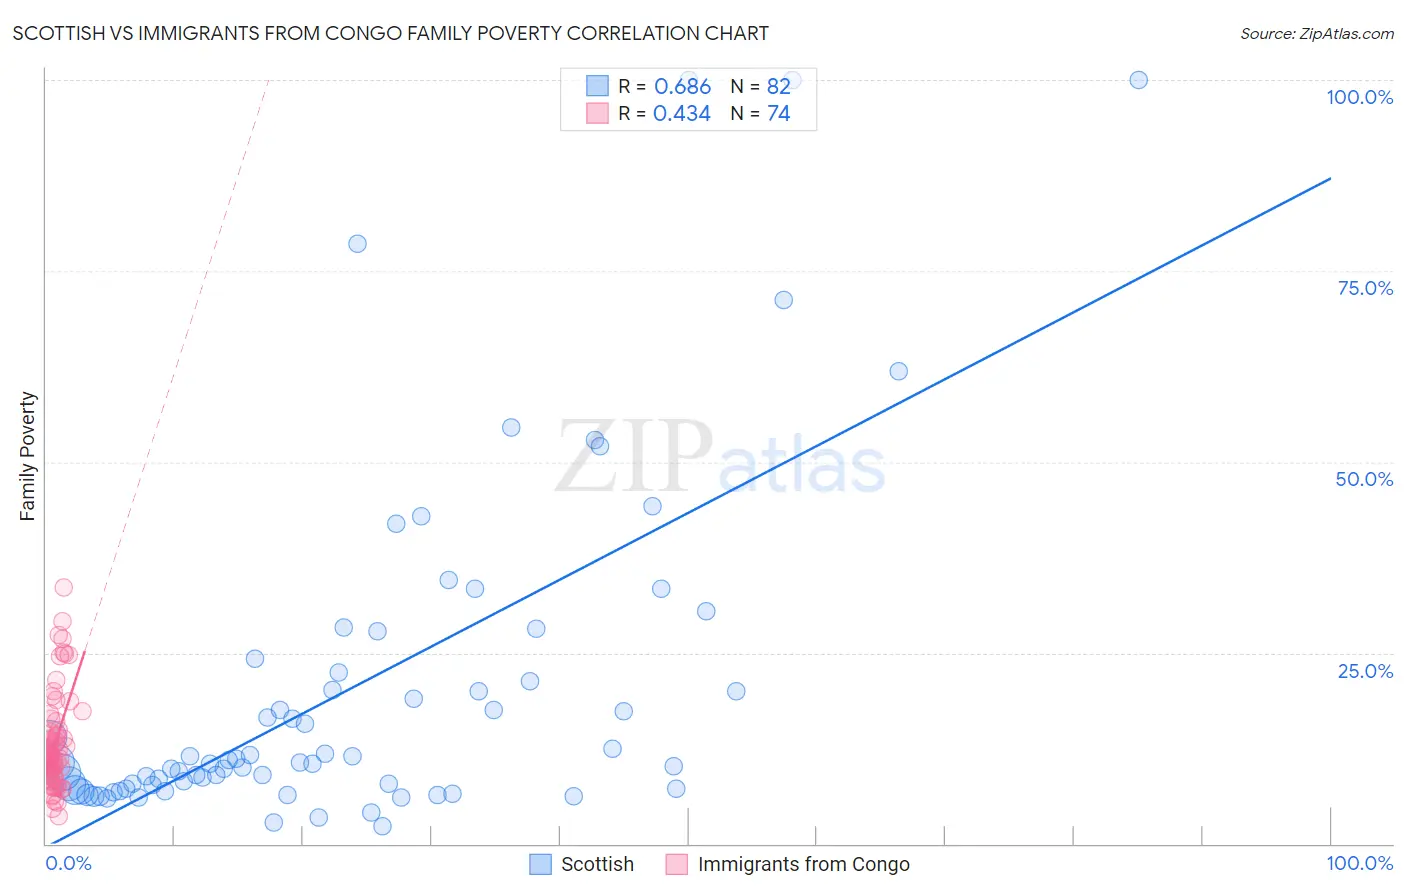
Scottish vs Immigrants from Congo Family Poverty Correlation Chart
The statistical analysis conducted on geographies consisting of 562,331,846 people shows a significant positive correlation between the proportion of Scottish and poverty level among families in the United States with a correlation coefficient (R) of 0.686 and weighted average of 7.9%. Similarly, the statistical analysis conducted on geographies consisting of 92,062,434 people shows a moderate positive correlation between the proportion of Immigrants from Congo and poverty level among families in the United States with a correlation coefficient (R) of 0.434 and weighted average of 11.9%, a difference of 49.7%.
Family Poverty Correlation Summary
| Measurement | Scottish | Immigrants from Congo |
| Minimum | 2.3% | 3.6% |
| Maximum | 100.0% | 33.5% |
| Range | 97.7% | 29.9% |
| Mean | 20.4% | 13.1% |
| Median | 10.7% | 11.6% |
| Interquartile 25% (IQ1) | 7.2% | 9.0% |
| Interquartile 75% (IQ3) | 22.4% | 14.5% |
| Interquartile Range (IQR) | 15.2% | 5.5% |
| Standard Deviation (Sample) | 22.2% | 6.1% |
| Standard Deviation (Population) | 22.1% | 6.1% |
Similar Demographics by Family Poverty
Demographics Similar to Scottish by Family Poverty
In terms of family poverty, the demographic groups most similar to Scottish are Immigrants from Asia (7.9%, a difference of 0.040%), Belgian (8.0%, a difference of 0.090%), Serbian (8.0%, a difference of 0.15%), British (7.9%, a difference of 0.29%), and Immigrants from Denmark (8.0%, a difference of 0.30%).
| Demographics | Rating | Rank | Family Poverty |
| Immigrants | Europe | 97.8 /100 | #79 | Exceptional 7.9% |
| English | 97.8 /100 | #80 | Exceptional 7.9% |
| Irish | 97.8 /100 | #81 | Exceptional 7.9% |
| Immigrants | Poland | 97.8 /100 | #82 | Exceptional 7.9% |
| Slovaks | 97.7 /100 | #83 | Exceptional 7.9% |
| British | 97.5 /100 | #84 | Exceptional 7.9% |
| Immigrants | Asia | 97.4 /100 | #85 | Exceptional 7.9% |
| Scottish | 97.3 /100 | #86 | Exceptional 7.9% |
| Belgians | 97.3 /100 | #87 | Exceptional 8.0% |
| Serbians | 97.2 /100 | #88 | Exceptional 8.0% |
| Immigrants | Denmark | 97.1 /100 | #89 | Exceptional 8.0% |
| Immigrants | England | 97.1 /100 | #90 | Exceptional 8.0% |
| Immigrants | Italy | 97.0 /100 | #91 | Exceptional 8.0% |
| Czechoslovakians | 96.8 /100 | #92 | Exceptional 8.0% |
| Tlingit-Haida | 96.7 /100 | #93 | Exceptional 8.0% |
Demographics Similar to Immigrants from Congo by Family Poverty
In terms of family poverty, the demographic groups most similar to Immigrants from Congo are Seminole (11.9%, a difference of 0.060%), Cajun (11.9%, a difference of 0.11%), Hispanic or Latino (12.0%, a difference of 0.50%), Immigrants from Guatemala (12.0%, a difference of 0.51%), and Mexican (11.8%, a difference of 0.67%).
| Demographics | Rating | Rank | Family Poverty |
| Immigrants | Bangladesh | 0.0 /100 | #300 | Tragic 11.7% |
| Bahamians | 0.0 /100 | #301 | Tragic 11.7% |
| Guatemalans | 0.0 /100 | #302 | Tragic 11.7% |
| Africans | 0.0 /100 | #303 | Tragic 11.8% |
| Immigrants | Latin America | 0.0 /100 | #304 | Tragic 11.8% |
| Mexicans | 0.0 /100 | #305 | Tragic 11.8% |
| Cajuns | 0.0 /100 | #306 | Tragic 11.9% |
| Immigrants | Congo | 0.0 /100 | #307 | Tragic 11.9% |
| Seminole | 0.0 /100 | #308 | Tragic 11.9% |
| Hispanics or Latinos | 0.0 /100 | #309 | Tragic 12.0% |
| Immigrants | Guatemala | 0.0 /100 | #310 | Tragic 12.0% |
| Ute | 0.0 /100 | #311 | Tragic 12.1% |
| Immigrants | Central America | 0.0 /100 | #312 | Tragic 12.1% |
| Immigrants | Caribbean | 0.0 /100 | #313 | Tragic 12.2% |
| Kiowa | 0.0 /100 | #314 | Tragic 12.2% |