Scottish vs Trinidadian and Tobagonian Median Family Income
COMPARE
Scottish
Trinidadian and Tobagonian
Median Family Income
Median Family Income Comparison
Scottish
Trinidadians and Tobagonians
$104,288
MEDIAN FAMILY INCOME
69.5/ 100
METRIC RATING
160th/ 347
METRIC RANK
$94,466
MEDIAN FAMILY INCOME
1.5/ 100
METRIC RATING
236th/ 347
METRIC RANK
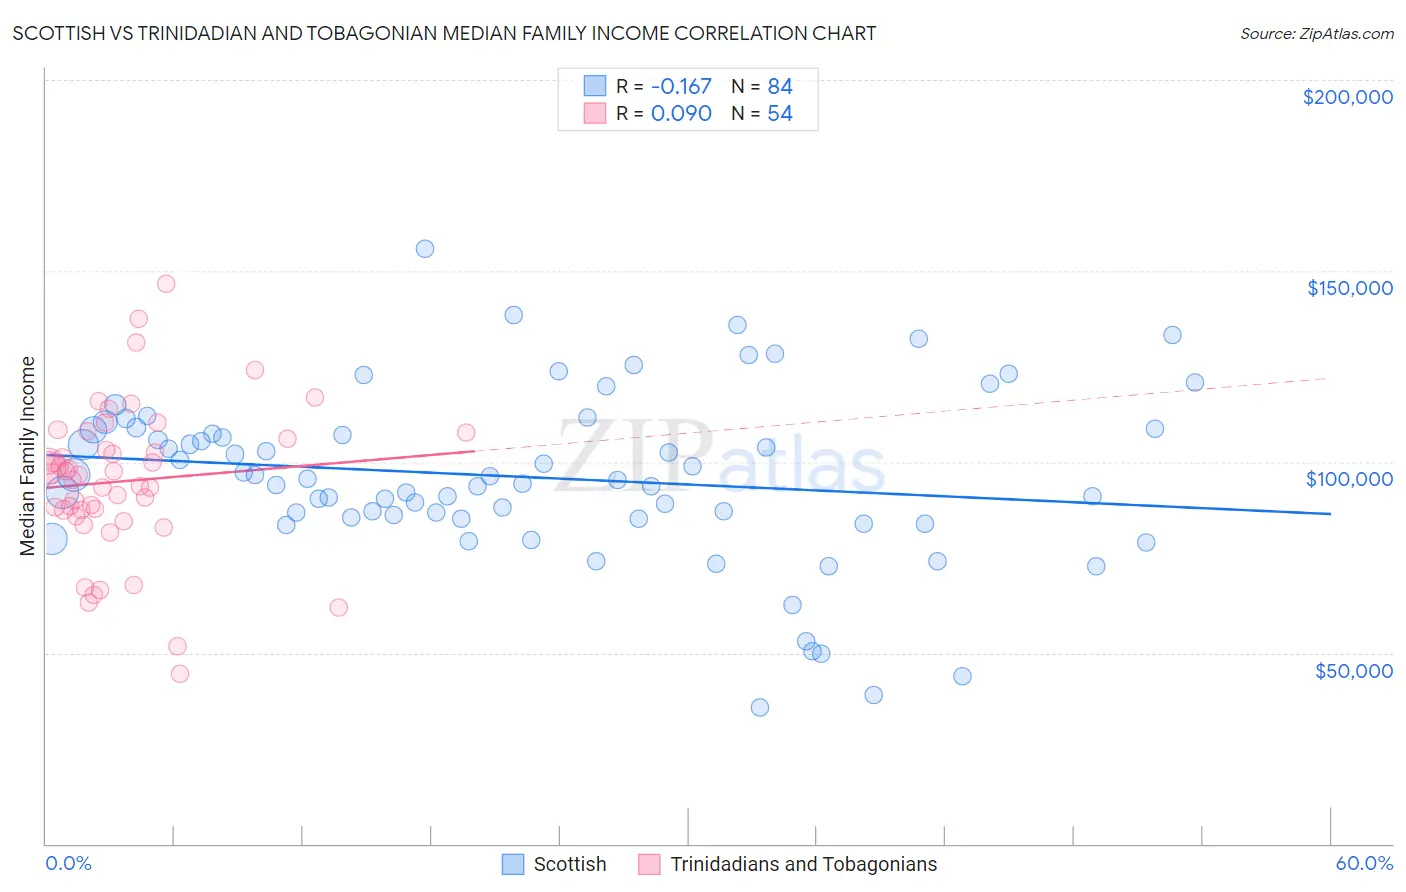
Scottish vs Trinidadian and Tobagonian Median Family Income Correlation Chart
The statistical analysis conducted on geographies consisting of 565,809,702 people shows a poor negative correlation between the proportion of Scottish and median family income in the United States with a correlation coefficient (R) of -0.167 and weighted average of $104,288. Similarly, the statistical analysis conducted on geographies consisting of 219,638,345 people shows a slight positive correlation between the proportion of Trinidadians and Tobagonians and median family income in the United States with a correlation coefficient (R) of 0.090 and weighted average of $94,466, a difference of 10.4%.
Median Family Income Correlation Summary
| Measurement | Scottish | Trinidadian and Tobagonian |
| Minimum | $35,833 | $44,583 |
| Maximum | $155,822 | $146,767 |
| Range | $119,989 | $102,184 |
| Mean | $95,991 | $94,928 |
| Median | $95,418 | $96,651 |
| Interquartile 25% (IQ1) | $85,332 | $87,494 |
| Interquartile 75% (IQ3) | $108,630 | $106,050 |
| Interquartile Range (IQR) | $23,298 | $18,556 |
| Standard Deviation (Sample) | $22,327 | $19,692 |
| Standard Deviation (Population) | $22,194 | $19,508 |
Similar Demographics by Median Family Income
Demographics Similar to Scottish by Median Family Income
In terms of median family income, the demographic groups most similar to Scottish are Icelander ($104,282, a difference of 0.010%), Swiss ($104,396, a difference of 0.10%), Scandinavian ($104,410, a difference of 0.12%), Moroccan ($104,488, a difference of 0.19%), and Immigrants from Sierra Leone ($103,990, a difference of 0.29%).
| Demographics | Rating | Rank | Median Family Income |
| Slavs | 77.9 /100 | #153 | Good $105,144 |
| Immigrants | Nepal | 76.3 /100 | #154 | Good $104,966 |
| Native Hawaiians | 75.8 /100 | #155 | Good $104,910 |
| Basques | 74.4 /100 | #156 | Good $104,760 |
| Moroccans | 71.6 /100 | #157 | Good $104,488 |
| Scandinavians | 70.8 /100 | #158 | Good $104,410 |
| Swiss | 70.7 /100 | #159 | Good $104,396 |
| Scottish | 69.5 /100 | #160 | Good $104,288 |
| Icelanders | 69.4 /100 | #161 | Good $104,282 |
| Immigrants | Sierra Leone | 66.2 /100 | #162 | Good $103,990 |
| Costa Ricans | 66.2 /100 | #163 | Good $103,989 |
| Sierra Leoneans | 64.7 /100 | #164 | Good $103,859 |
| Slovaks | 63.1 /100 | #165 | Good $103,729 |
| English | 62.6 /100 | #166 | Good $103,684 |
| South American Indians | 61.9 /100 | #167 | Good $103,624 |
Demographics Similar to Trinidadians and Tobagonians by Median Family Income
In terms of median family income, the demographic groups most similar to Trinidadians and Tobagonians are Immigrants from Burma/Myanmar ($94,472, a difference of 0.010%), Alaskan Athabascan ($94,429, a difference of 0.040%), Immigrants from Western Africa ($94,638, a difference of 0.18%), Immigrants from Bangladesh ($94,665, a difference of 0.21%), and Nepalese ($94,153, a difference of 0.33%).
| Demographics | Rating | Rank | Median Family Income |
| Marshallese | 2.2 /100 | #229 | Tragic $95,293 |
| Malaysians | 2.2 /100 | #230 | Tragic $95,230 |
| Ecuadorians | 2.1 /100 | #231 | Tragic $95,114 |
| Immigrants | Venezuela | 1.9 /100 | #232 | Tragic $94,904 |
| Immigrants | Bangladesh | 1.6 /100 | #233 | Tragic $94,665 |
| Immigrants | Western Africa | 1.6 /100 | #234 | Tragic $94,638 |
| Immigrants | Burma/Myanmar | 1.5 /100 | #235 | Tragic $94,472 |
| Trinidadians and Tobagonians | 1.5 /100 | #236 | Tragic $94,466 |
| Alaskan Athabascans | 1.5 /100 | #237 | Tragic $94,429 |
| Nepalese | 1.3 /100 | #238 | Tragic $94,153 |
| Salvadorans | 1.2 /100 | #239 | Tragic $94,109 |
| Somalis | 1.2 /100 | #240 | Tragic $94,085 |
| Immigrants | Trinidad and Tobago | 1.2 /100 | #241 | Tragic $93,988 |
| Barbadians | 1.1 /100 | #242 | Tragic $93,919 |
| German Russians | 1.1 /100 | #243 | Tragic $93,858 |