Scottish vs Immigrants from Guyana Family Poverty
COMPARE
Scottish
Immigrants from Guyana
Family Poverty
Family Poverty Comparison
Scottish
Immigrants from Guyana
7.9%
FAMILY POVERTY
97.3/ 100
METRIC RATING
86th/ 347
METRIC RANK
11.2%
FAMILY POVERTY
0.1/ 100
METRIC RATING
276th/ 347
METRIC RANK
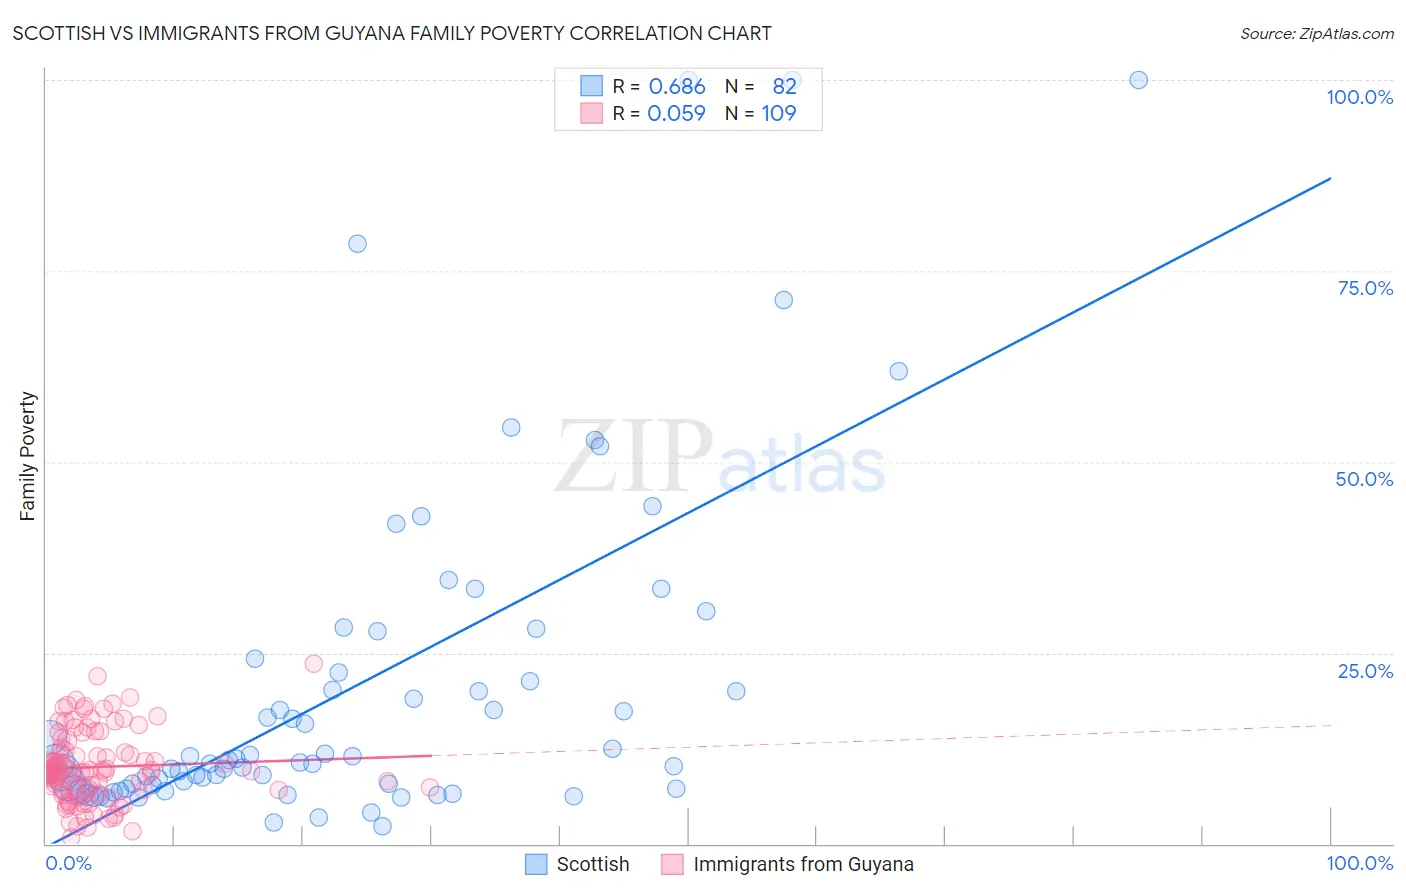
Scottish vs Immigrants from Guyana Family Poverty Correlation Chart
The statistical analysis conducted on geographies consisting of 562,331,846 people shows a significant positive correlation between the proportion of Scottish and poverty level among families in the United States with a correlation coefficient (R) of 0.686 and weighted average of 7.9%. Similarly, the statistical analysis conducted on geographies consisting of 183,364,556 people shows a slight positive correlation between the proportion of Immigrants from Guyana and poverty level among families in the United States with a correlation coefficient (R) of 0.059 and weighted average of 11.2%, a difference of 41.3%.
Family Poverty Correlation Summary
| Measurement | Scottish | Immigrants from Guyana |
| Minimum | 2.3% | 0.84% |
| Maximum | 100.0% | 23.6% |
| Range | 97.7% | 22.8% |
| Mean | 20.4% | 10.0% |
| Median | 10.7% | 9.6% |
| Interquartile 25% (IQ1) | 7.2% | 7.0% |
| Interquartile 75% (IQ3) | 22.4% | 12.5% |
| Interquartile Range (IQR) | 15.2% | 5.5% |
| Standard Deviation (Sample) | 22.2% | 4.6% |
| Standard Deviation (Population) | 22.1% | 4.6% |
Similar Demographics by Family Poverty
Demographics Similar to Scottish by Family Poverty
In terms of family poverty, the demographic groups most similar to Scottish are Immigrants from Asia (7.9%, a difference of 0.040%), Belgian (8.0%, a difference of 0.090%), Serbian (8.0%, a difference of 0.15%), British (7.9%, a difference of 0.29%), and Immigrants from Denmark (8.0%, a difference of 0.30%).
| Demographics | Rating | Rank | Family Poverty |
| Immigrants | Europe | 97.8 /100 | #79 | Exceptional 7.9% |
| English | 97.8 /100 | #80 | Exceptional 7.9% |
| Irish | 97.8 /100 | #81 | Exceptional 7.9% |
| Immigrants | Poland | 97.8 /100 | #82 | Exceptional 7.9% |
| Slovaks | 97.7 /100 | #83 | Exceptional 7.9% |
| British | 97.5 /100 | #84 | Exceptional 7.9% |
| Immigrants | Asia | 97.4 /100 | #85 | Exceptional 7.9% |
| Scottish | 97.3 /100 | #86 | Exceptional 7.9% |
| Belgians | 97.3 /100 | #87 | Exceptional 8.0% |
| Serbians | 97.2 /100 | #88 | Exceptional 8.0% |
| Immigrants | Denmark | 97.1 /100 | #89 | Exceptional 8.0% |
| Immigrants | England | 97.1 /100 | #90 | Exceptional 8.0% |
| Immigrants | Italy | 97.0 /100 | #91 | Exceptional 8.0% |
| Czechoslovakians | 96.8 /100 | #92 | Exceptional 8.0% |
| Tlingit-Haida | 96.7 /100 | #93 | Exceptional 8.0% |
Demographics Similar to Immigrants from Guyana by Family Poverty
In terms of family poverty, the demographic groups most similar to Immigrants from Guyana are Central American (11.2%, a difference of 0.020%), Spanish American (11.2%, a difference of 0.070%), Chippewa (11.2%, a difference of 0.090%), Guyanese (11.2%, a difference of 0.12%), and Somali (11.2%, a difference of 0.16%).
| Demographics | Rating | Rank | Family Poverty |
| Immigrants | Ecuador | 0.1 /100 | #269 | Tragic 11.1% |
| Immigrants | Nicaragua | 0.1 /100 | #270 | Tragic 11.1% |
| Immigrants | Bahamas | 0.1 /100 | #271 | Tragic 11.1% |
| Immigrants | Jamaica | 0.1 /100 | #272 | Tragic 11.2% |
| Somalis | 0.1 /100 | #273 | Tragic 11.2% |
| Spanish Americans | 0.1 /100 | #274 | Tragic 11.2% |
| Central Americans | 0.1 /100 | #275 | Tragic 11.2% |
| Immigrants | Guyana | 0.1 /100 | #276 | Tragic 11.2% |
| Chippewa | 0.1 /100 | #277 | Tragic 11.2% |
| Guyanese | 0.1 /100 | #278 | Tragic 11.2% |
| Blackfeet | 0.0 /100 | #279 | Tragic 11.3% |
| Belizeans | 0.0 /100 | #280 | Tragic 11.3% |
| Immigrants | West Indies | 0.0 /100 | #281 | Tragic 11.3% |
| Immigrants | Cuba | 0.0 /100 | #282 | Tragic 11.3% |
| Indonesians | 0.0 /100 | #283 | Tragic 11.3% |