Scottish vs Immigrants from Liberia Family Poverty
COMPARE
Scottish
Immigrants from Liberia
Family Poverty
Family Poverty Comparison
Scottish
Immigrants from Liberia
7.9%
FAMILY POVERTY
97.3/ 100
METRIC RATING
86th/ 347
METRIC RANK
10.8%
FAMILY POVERTY
0.2/ 100
METRIC RATING
255th/ 347
METRIC RANK
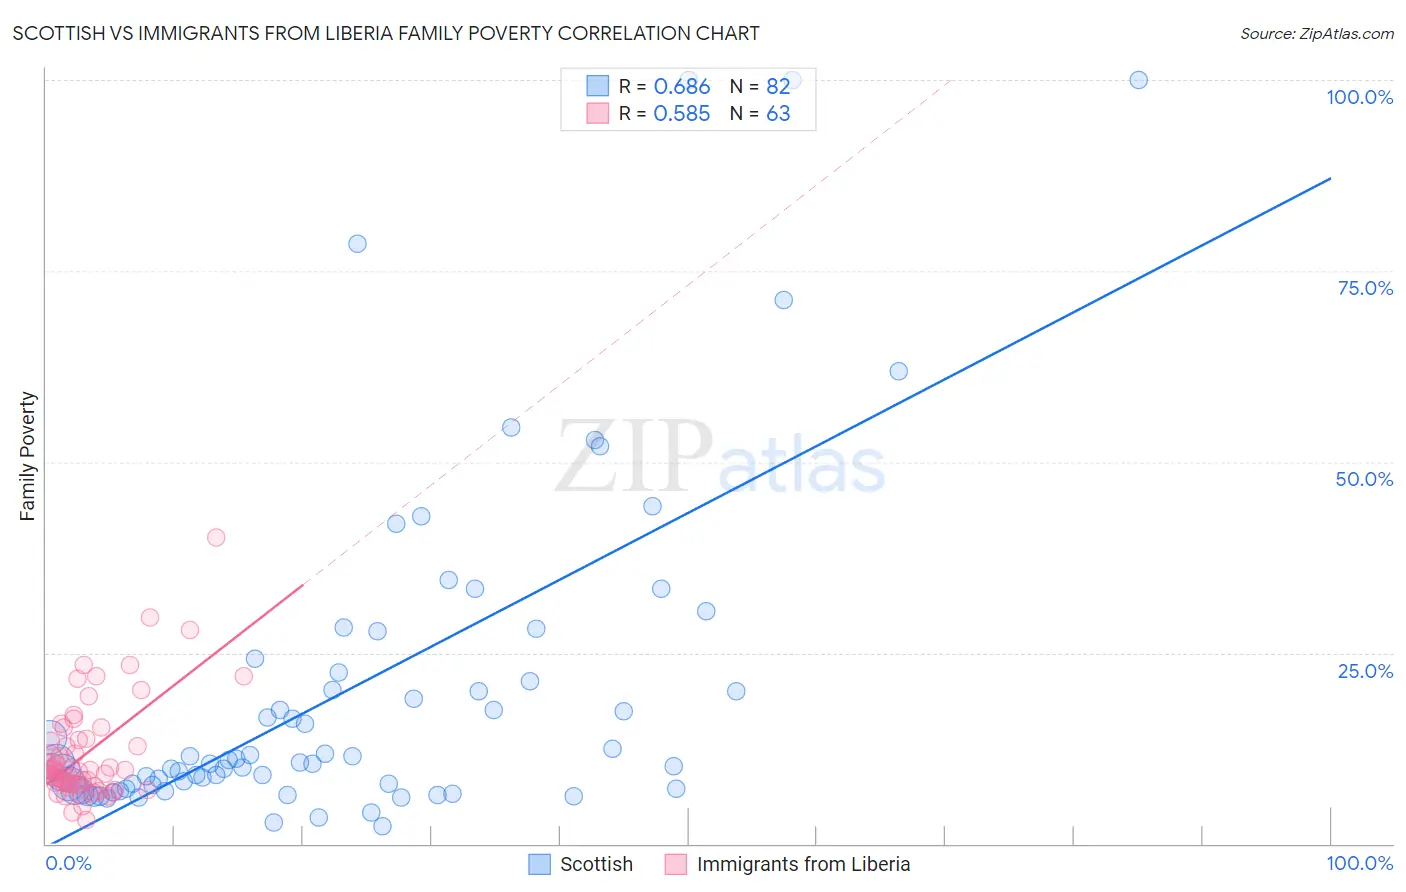
Scottish vs Immigrants from Liberia Family Poverty Correlation Chart
The statistical analysis conducted on geographies consisting of 562,331,846 people shows a significant positive correlation between the proportion of Scottish and poverty level among families in the United States with a correlation coefficient (R) of 0.686 and weighted average of 7.9%. Similarly, the statistical analysis conducted on geographies consisting of 135,184,573 people shows a substantial positive correlation between the proportion of Immigrants from Liberia and poverty level among families in the United States with a correlation coefficient (R) of 0.585 and weighted average of 10.8%, a difference of 36.1%.
Family Poverty Correlation Summary
| Measurement | Scottish | Immigrants from Liberia |
| Minimum | 2.3% | 3.1% |
| Maximum | 100.0% | 40.1% |
| Range | 97.7% | 37.0% |
| Mean | 20.4% | 11.9% |
| Median | 10.7% | 9.6% |
| Interquartile 25% (IQ1) | 7.2% | 7.8% |
| Interquartile 75% (IQ3) | 22.4% | 13.8% |
| Interquartile Range (IQR) | 15.2% | 6.0% |
| Standard Deviation (Sample) | 22.2% | 6.8% |
| Standard Deviation (Population) | 22.1% | 6.7% |
Similar Demographics by Family Poverty
Demographics Similar to Scottish by Family Poverty
In terms of family poverty, the demographic groups most similar to Scottish are Immigrants from Asia (7.9%, a difference of 0.040%), Belgian (8.0%, a difference of 0.090%), Serbian (8.0%, a difference of 0.15%), British (7.9%, a difference of 0.29%), and Immigrants from Denmark (8.0%, a difference of 0.30%).
| Demographics | Rating | Rank | Family Poverty |
| Immigrants | Europe | 97.8 /100 | #79 | Exceptional 7.9% |
| English | 97.8 /100 | #80 | Exceptional 7.9% |
| Irish | 97.8 /100 | #81 | Exceptional 7.9% |
| Immigrants | Poland | 97.8 /100 | #82 | Exceptional 7.9% |
| Slovaks | 97.7 /100 | #83 | Exceptional 7.9% |
| British | 97.5 /100 | #84 | Exceptional 7.9% |
| Immigrants | Asia | 97.4 /100 | #85 | Exceptional 7.9% |
| Scottish | 97.3 /100 | #86 | Exceptional 7.9% |
| Belgians | 97.3 /100 | #87 | Exceptional 8.0% |
| Serbians | 97.2 /100 | #88 | Exceptional 8.0% |
| Immigrants | Denmark | 97.1 /100 | #89 | Exceptional 8.0% |
| Immigrants | England | 97.1 /100 | #90 | Exceptional 8.0% |
| Immigrants | Italy | 97.0 /100 | #91 | Exceptional 8.0% |
| Czechoslovakians | 96.8 /100 | #92 | Exceptional 8.0% |
| Tlingit-Haida | 96.7 /100 | #93 | Exceptional 8.0% |
Demographics Similar to Immigrants from Liberia by Family Poverty
In terms of family poverty, the demographic groups most similar to Immigrants from Liberia are Chickasaw (10.8%, a difference of 0.26%), Immigrants from Ghana (10.8%, a difference of 0.30%), Subsaharan African (10.9%, a difference of 0.34%), Ecuadorian (10.8%, a difference of 0.37%), and Mexican American Indian (10.9%, a difference of 0.38%).
| Demographics | Rating | Rank | Family Poverty |
| Nicaraguans | 0.4 /100 | #248 | Tragic 10.6% |
| Cubans | 0.4 /100 | #249 | Tragic 10.6% |
| Salvadorans | 0.3 /100 | #250 | Tragic 10.7% |
| Iroquois | 0.3 /100 | #251 | Tragic 10.7% |
| Immigrants | Zaire | 0.3 /100 | #252 | Tragic 10.7% |
| Immigrants | Western Africa | 0.3 /100 | #253 | Tragic 10.7% |
| Ecuadorians | 0.2 /100 | #254 | Tragic 10.8% |
| Immigrants | Liberia | 0.2 /100 | #255 | Tragic 10.8% |
| Chickasaw | 0.2 /100 | #256 | Tragic 10.8% |
| Immigrants | Ghana | 0.2 /100 | #257 | Tragic 10.8% |
| Sub-Saharan Africans | 0.2 /100 | #258 | Tragic 10.9% |
| Mexican American Indians | 0.2 /100 | #259 | Tragic 10.9% |
| Bangladeshis | 0.2 /100 | #260 | Tragic 10.9% |
| Shoshone | 0.2 /100 | #261 | Tragic 10.9% |
| Spanish American Indians | 0.2 /100 | #262 | Tragic 10.9% |