Nicaraguan vs Immigrants from Netherlands Female Poverty
COMPARE
Nicaraguan
Immigrants from Netherlands
Female Poverty
Female Poverty Comparison
Nicaraguans
Immigrants from Netherlands
15.3%
FEMALE POVERTY
0.3/ 100
METRIC RATING
243rd/ 347
METRIC RANK
12.2%
FEMALE POVERTY
97.8/ 100
METRIC RATING
68th/ 347
METRIC RANK
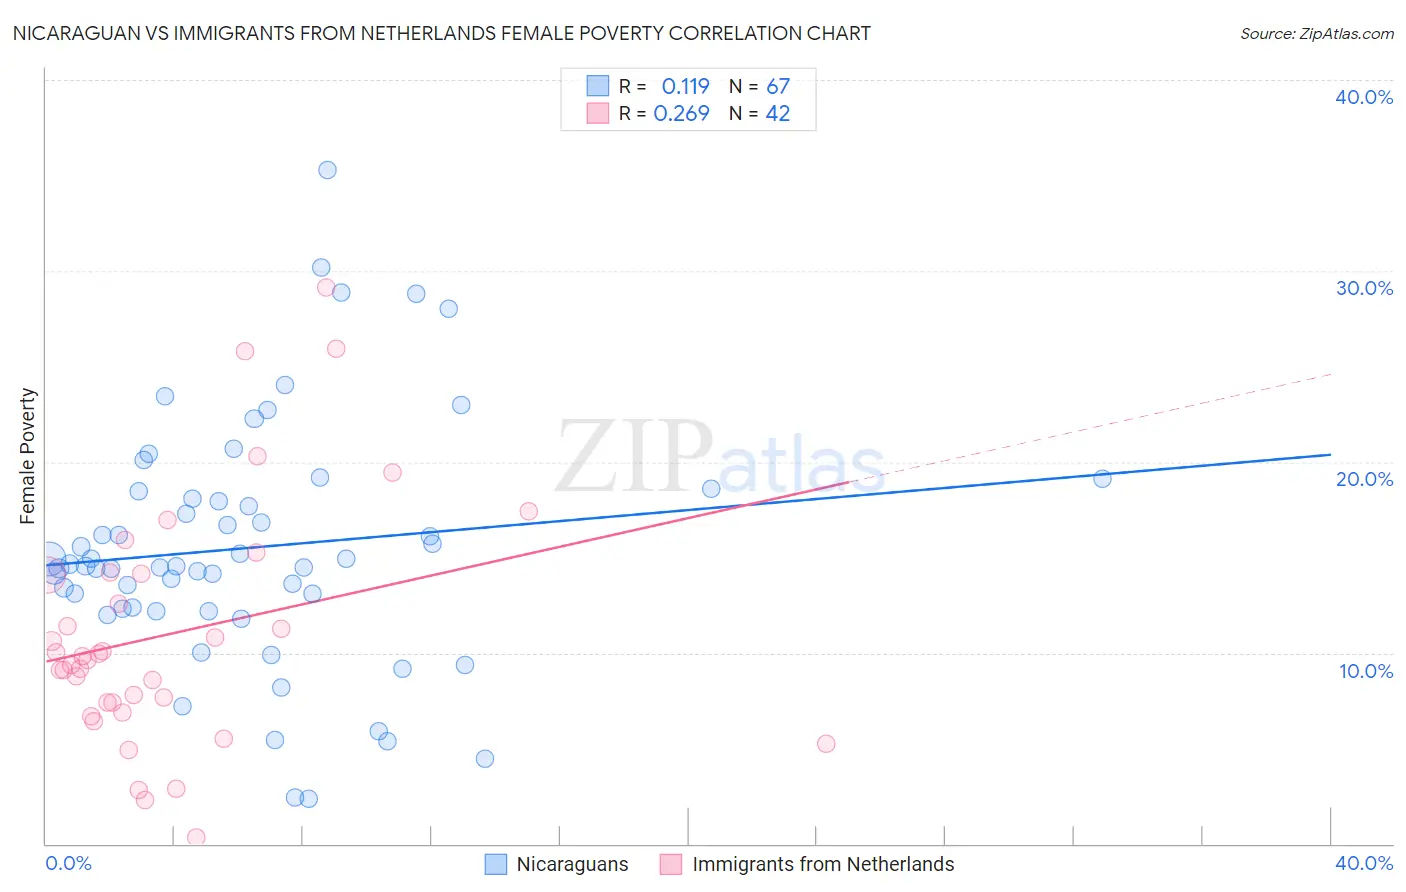
Nicaraguan vs Immigrants from Netherlands Female Poverty Correlation Chart
The statistical analysis conducted on geographies consisting of 285,582,633 people shows a poor positive correlation between the proportion of Nicaraguans and poverty level among females in the United States with a correlation coefficient (R) of 0.119 and weighted average of 15.3%. Similarly, the statistical analysis conducted on geographies consisting of 237,788,507 people shows a weak positive correlation between the proportion of Immigrants from Netherlands and poverty level among females in the United States with a correlation coefficient (R) of 0.269 and weighted average of 12.2%, a difference of 25.0%.
Female Poverty Correlation Summary
| Measurement | Nicaraguan | Immigrants from Netherlands |
| Minimum | 2.4% | 0.30% |
| Maximum | 35.3% | 29.1% |
| Range | 32.9% | 28.8% |
| Mean | 15.5% | 11.0% |
| Median | 14.6% | 9.7% |
| Interquartile 25% (IQ1) | 12.3% | 7.4% |
| Interquartile 75% (IQ3) | 18.5% | 14.1% |
| Interquartile Range (IQR) | 6.2% | 6.7% |
| Standard Deviation (Sample) | 6.4% | 6.3% |
| Standard Deviation (Population) | 6.3% | 6.2% |
Similar Demographics by Female Poverty
Demographics Similar to Nicaraguans by Female Poverty
In terms of female poverty, the demographic groups most similar to Nicaraguans are Ecuadorian (15.3%, a difference of 0.050%), Spanish American Indian (15.3%, a difference of 0.15%), Cuban (15.3%, a difference of 0.20%), Potawatomi (15.3%, a difference of 0.21%), and Immigrants from Ghana (15.3%, a difference of 0.21%).
| Demographics | Rating | Rank | Female Poverty |
| Cree | 0.7 /100 | #236 | Tragic 15.1% |
| French American Indians | 0.6 /100 | #237 | Tragic 15.1% |
| Immigrants | Armenia | 0.6 /100 | #238 | Tragic 15.1% |
| Immigrants | Middle Africa | 0.5 /100 | #239 | Tragic 15.2% |
| Sudanese | 0.5 /100 | #240 | Tragic 15.2% |
| Immigrants | Sudan | 0.4 /100 | #241 | Tragic 15.2% |
| Nepalese | 0.4 /100 | #242 | Tragic 15.2% |
| Nicaraguans | 0.3 /100 | #243 | Tragic 15.3% |
| Ecuadorians | 0.3 /100 | #244 | Tragic 15.3% |
| Spanish American Indians | 0.3 /100 | #245 | Tragic 15.3% |
| Cubans | 0.3 /100 | #246 | Tragic 15.3% |
| Potawatomi | 0.3 /100 | #247 | Tragic 15.3% |
| Immigrants | Ghana | 0.3 /100 | #248 | Tragic 15.3% |
| Salvadorans | 0.3 /100 | #249 | Tragic 15.3% |
| Immigrants | Western Africa | 0.3 /100 | #250 | Tragic 15.3% |
Demographics Similar to Immigrants from Netherlands by Female Poverty
In terms of female poverty, the demographic groups most similar to Immigrants from Netherlands are Immigrants from Eastern Asia (12.2%, a difference of 0.040%), Swiss (12.2%, a difference of 0.10%), Immigrants from Belgium (12.2%, a difference of 0.13%), Austrian (12.2%, a difference of 0.17%), and Indian (Asian) (12.2%, a difference of 0.18%).
| Demographics | Rating | Rank | Female Poverty |
| Immigrants | Asia | 98.1 /100 | #61 | Exceptional 12.2% |
| Immigrants | Italy | 98.0 /100 | #62 | Exceptional 12.2% |
| Ukrainians | 98.0 /100 | #63 | Exceptional 12.2% |
| Germans | 98.0 /100 | #64 | Exceptional 12.2% |
| Indians (Asian) | 97.9 /100 | #65 | Exceptional 12.2% |
| Austrians | 97.9 /100 | #66 | Exceptional 12.2% |
| Immigrants | Eastern Asia | 97.8 /100 | #67 | Exceptional 12.2% |
| Immigrants | Netherlands | 97.8 /100 | #68 | Exceptional 12.2% |
| Swiss | 97.7 /100 | #69 | Exceptional 12.2% |
| Immigrants | Belgium | 97.7 /100 | #70 | Exceptional 12.2% |
| Carpatho Rusyns | 97.6 /100 | #71 | Exceptional 12.2% |
| Cambodians | 97.5 /100 | #72 | Exceptional 12.2% |
| Zimbabweans | 97.5 /100 | #73 | Exceptional 12.3% |
| Immigrants | Canada | 97.5 /100 | #74 | Exceptional 12.3% |
| Europeans | 97.4 /100 | #75 | Exceptional 12.3% |