Celtic vs Immigrants from Netherlands Female Poverty
COMPARE
Celtic
Immigrants from Netherlands
Female Poverty
Female Poverty Comparison
Celtics
Immigrants from Netherlands
13.4%
FEMALE POVERTY
49.9/ 100
METRIC RATING
175th/ 347
METRIC RANK
12.2%
FEMALE POVERTY
97.8/ 100
METRIC RATING
68th/ 347
METRIC RANK
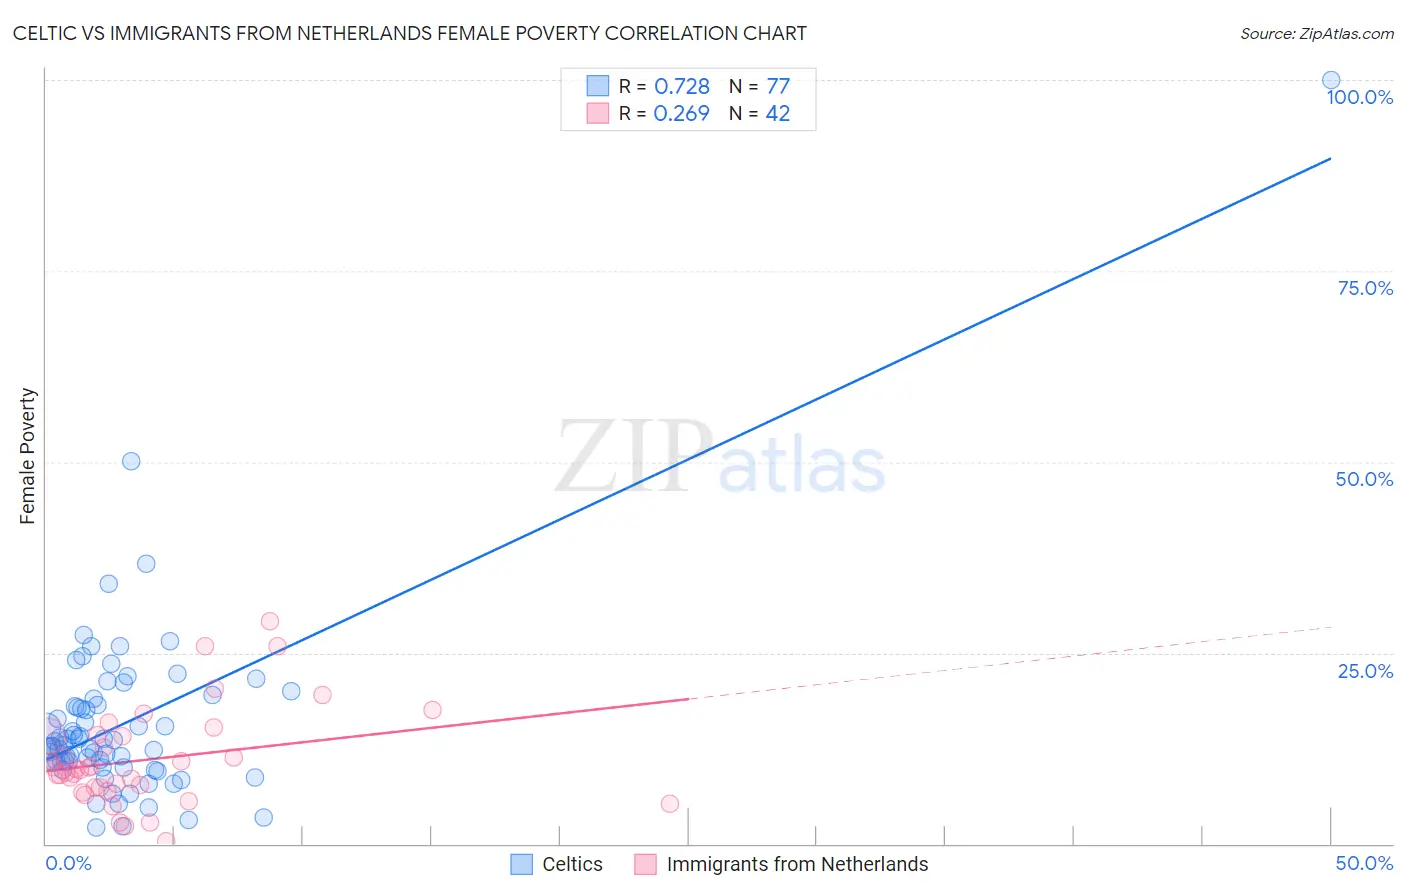
Celtic vs Immigrants from Netherlands Female Poverty Correlation Chart
The statistical analysis conducted on geographies consisting of 168,846,795 people shows a strong positive correlation between the proportion of Celtics and poverty level among females in the United States with a correlation coefficient (R) of 0.728 and weighted average of 13.4%. Similarly, the statistical analysis conducted on geographies consisting of 237,788,507 people shows a weak positive correlation between the proportion of Immigrants from Netherlands and poverty level among females in the United States with a correlation coefficient (R) of 0.269 and weighted average of 12.2%, a difference of 10.1%.
Female Poverty Correlation Summary
| Measurement | Celtic | Immigrants from Netherlands |
| Minimum | 2.2% | 0.30% |
| Maximum | 100.0% | 29.1% |
| Range | 97.8% | 28.8% |
| Mean | 15.9% | 11.0% |
| Median | 12.9% | 9.7% |
| Interquartile 25% (IQ1) | 10.3% | 7.4% |
| Interquartile 75% (IQ3) | 18.6% | 14.1% |
| Interquartile Range (IQR) | 8.3% | 6.7% |
| Standard Deviation (Sample) | 12.5% | 6.3% |
| Standard Deviation (Population) | 12.5% | 6.2% |
Similar Demographics by Female Poverty
Demographics Similar to Celtics by Female Poverty
In terms of female poverty, the demographic groups most similar to Celtics are Immigrants from Spain (13.4%, a difference of 0.0%), Immigrants from Iraq (13.4%, a difference of 0.010%), Immigrants from Morocco (13.4%, a difference of 0.050%), Immigrants from Afghanistan (13.4%, a difference of 0.080%), and Israeli (13.5%, a difference of 0.080%).
| Demographics | Rating | Rank | Female Poverty |
| Aleuts | 56.7 /100 | #168 | Average 13.4% |
| Lebanese | 55.9 /100 | #169 | Average 13.4% |
| Colombians | 55.7 /100 | #170 | Average 13.4% |
| Whites/Caucasians | 54.6 /100 | #171 | Average 13.4% |
| Mongolians | 53.6 /100 | #172 | Average 13.4% |
| Immigrants | Afghanistan | 50.8 /100 | #173 | Average 13.4% |
| Immigrants | Iraq | 50.0 /100 | #174 | Average 13.4% |
| Celtics | 49.9 /100 | #175 | Average 13.4% |
| Immigrants | Spain | 49.9 /100 | #176 | Average 13.4% |
| Immigrants | Morocco | 49.4 /100 | #177 | Average 13.4% |
| Israelis | 49.1 /100 | #178 | Average 13.5% |
| Immigrants | Syria | 48.8 /100 | #179 | Average 13.5% |
| South Americans | 44.8 /100 | #180 | Average 13.5% |
| Venezuelans | 44.5 /100 | #181 | Average 13.5% |
| Immigrants | Colombia | 44.5 /100 | #182 | Average 13.5% |
Demographics Similar to Immigrants from Netherlands by Female Poverty
In terms of female poverty, the demographic groups most similar to Immigrants from Netherlands are Immigrants from Eastern Asia (12.2%, a difference of 0.040%), Swiss (12.2%, a difference of 0.10%), Immigrants from Belgium (12.2%, a difference of 0.13%), Austrian (12.2%, a difference of 0.17%), and Indian (Asian) (12.2%, a difference of 0.18%).
| Demographics | Rating | Rank | Female Poverty |
| Immigrants | Asia | 98.1 /100 | #61 | Exceptional 12.2% |
| Immigrants | Italy | 98.0 /100 | #62 | Exceptional 12.2% |
| Ukrainians | 98.0 /100 | #63 | Exceptional 12.2% |
| Germans | 98.0 /100 | #64 | Exceptional 12.2% |
| Indians (Asian) | 97.9 /100 | #65 | Exceptional 12.2% |
| Austrians | 97.9 /100 | #66 | Exceptional 12.2% |
| Immigrants | Eastern Asia | 97.8 /100 | #67 | Exceptional 12.2% |
| Immigrants | Netherlands | 97.8 /100 | #68 | Exceptional 12.2% |
| Swiss | 97.7 /100 | #69 | Exceptional 12.2% |
| Immigrants | Belgium | 97.7 /100 | #70 | Exceptional 12.2% |
| Carpatho Rusyns | 97.6 /100 | #71 | Exceptional 12.2% |
| Cambodians | 97.5 /100 | #72 | Exceptional 12.2% |
| Zimbabweans | 97.5 /100 | #73 | Exceptional 12.3% |
| Immigrants | Canada | 97.5 /100 | #74 | Exceptional 12.3% |
| Europeans | 97.4 /100 | #75 | Exceptional 12.3% |