Somali vs Immigrants from Netherlands Female Poverty
COMPARE
Somali
Immigrants from Netherlands
Female Poverty
Female Poverty Comparison
Somalis
Immigrants from Netherlands
16.6%
FEMALE POVERTY
0.0/ 100
METRIC RATING
298th/ 347
METRIC RANK
12.2%
FEMALE POVERTY
97.8/ 100
METRIC RATING
68th/ 347
METRIC RANK
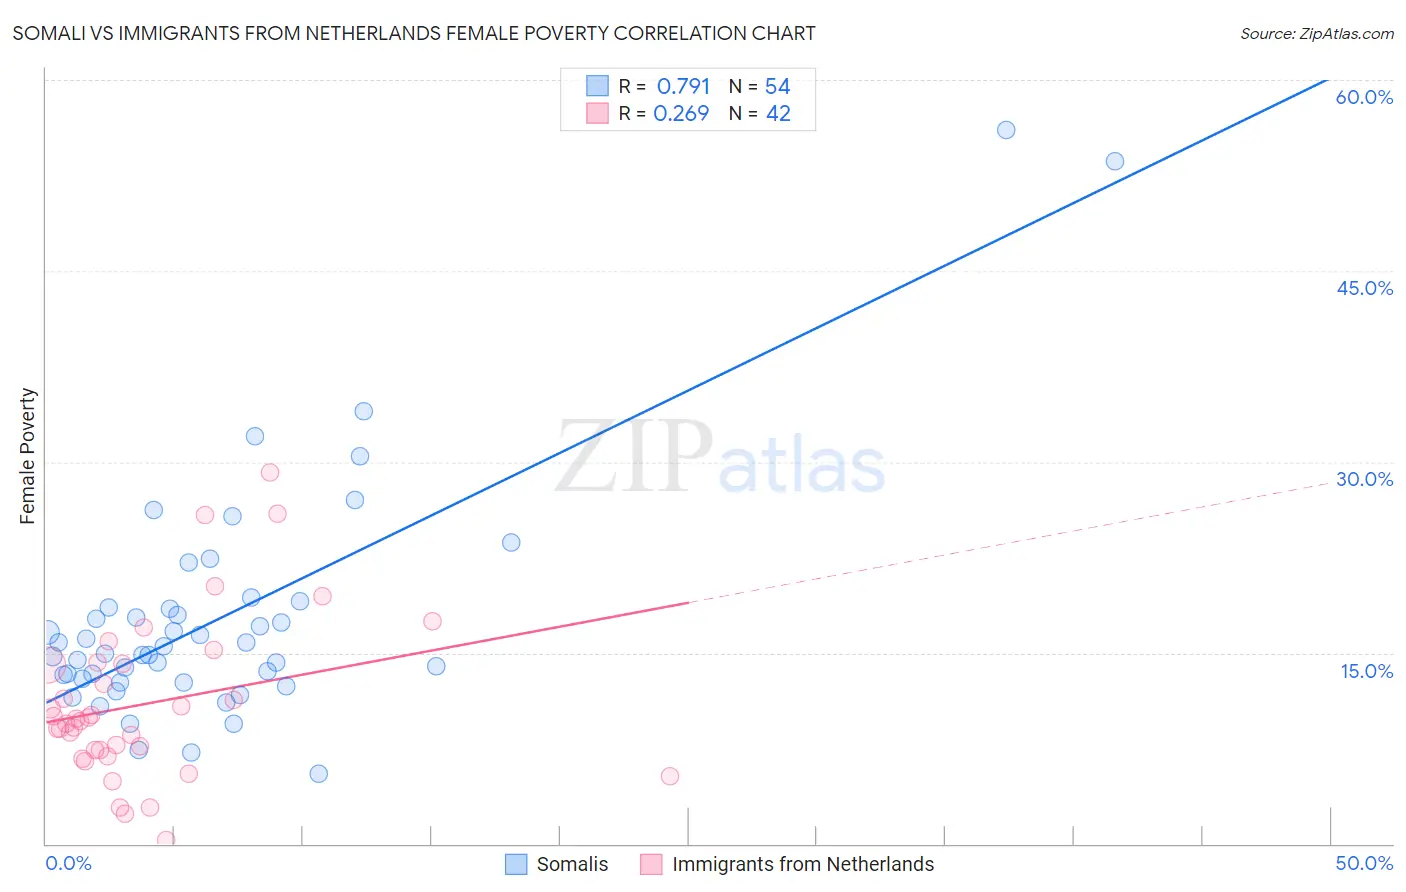
Somali vs Immigrants from Netherlands Female Poverty Correlation Chart
The statistical analysis conducted on geographies consisting of 99,282,230 people shows a strong positive correlation between the proportion of Somalis and poverty level among females in the United States with a correlation coefficient (R) of 0.791 and weighted average of 16.6%. Similarly, the statistical analysis conducted on geographies consisting of 237,788,507 people shows a weak positive correlation between the proportion of Immigrants from Netherlands and poverty level among females in the United States with a correlation coefficient (R) of 0.269 and weighted average of 12.2%, a difference of 35.5%.
Female Poverty Correlation Summary
| Measurement | Somali | Immigrants from Netherlands |
| Minimum | 5.5% | 0.30% |
| Maximum | 56.1% | 29.1% |
| Range | 50.6% | 28.8% |
| Mean | 17.8% | 11.0% |
| Median | 15.2% | 9.7% |
| Interquartile 25% (IQ1) | 13.0% | 7.4% |
| Interquartile 75% (IQ3) | 18.6% | 14.1% |
| Interquartile Range (IQR) | 5.6% | 6.7% |
| Standard Deviation (Sample) | 9.4% | 6.3% |
| Standard Deviation (Population) | 9.3% | 6.2% |
Similar Demographics by Female Poverty
Demographics Similar to Somalis by Female Poverty
In terms of female poverty, the demographic groups most similar to Somalis are Mexican (16.5%, a difference of 0.20%), Hispanic or Latino (16.6%, a difference of 0.52%), Bahamian (16.6%, a difference of 0.56%), Immigrants from Senegal (16.5%, a difference of 0.60%), and Senegalese (16.5%, a difference of 0.62%).
| Demographics | Rating | Rank | Female Poverty |
| Yaqui | 0.0 /100 | #291 | Tragic 16.4% |
| Immigrants | Zaire | 0.0 /100 | #292 | Tragic 16.4% |
| Immigrants | Latin America | 0.0 /100 | #293 | Tragic 16.4% |
| Immigrants | Cabo Verde | 0.0 /100 | #294 | Tragic 16.4% |
| Senegalese | 0.0 /100 | #295 | Tragic 16.5% |
| Immigrants | Senegal | 0.0 /100 | #296 | Tragic 16.5% |
| Mexicans | 0.0 /100 | #297 | Tragic 16.5% |
| Somalis | 0.0 /100 | #298 | Tragic 16.6% |
| Hispanics or Latinos | 0.0 /100 | #299 | Tragic 16.6% |
| Bahamians | 0.0 /100 | #300 | Tragic 16.6% |
| Guatemalans | 0.0 /100 | #301 | Tragic 16.7% |
| Chippewa | 0.0 /100 | #302 | Tragic 16.7% |
| Choctaw | 0.0 /100 | #303 | Tragic 16.8% |
| Immigrants | Central America | 0.0 /100 | #304 | Tragic 16.8% |
| Immigrants | Grenada | 0.0 /100 | #305 | Tragic 16.8% |
Demographics Similar to Immigrants from Netherlands by Female Poverty
In terms of female poverty, the demographic groups most similar to Immigrants from Netherlands are Immigrants from Eastern Asia (12.2%, a difference of 0.040%), Swiss (12.2%, a difference of 0.10%), Immigrants from Belgium (12.2%, a difference of 0.13%), Austrian (12.2%, a difference of 0.17%), and Indian (Asian) (12.2%, a difference of 0.18%).
| Demographics | Rating | Rank | Female Poverty |
| Immigrants | Asia | 98.1 /100 | #61 | Exceptional 12.2% |
| Immigrants | Italy | 98.0 /100 | #62 | Exceptional 12.2% |
| Ukrainians | 98.0 /100 | #63 | Exceptional 12.2% |
| Germans | 98.0 /100 | #64 | Exceptional 12.2% |
| Indians (Asian) | 97.9 /100 | #65 | Exceptional 12.2% |
| Austrians | 97.9 /100 | #66 | Exceptional 12.2% |
| Immigrants | Eastern Asia | 97.8 /100 | #67 | Exceptional 12.2% |
| Immigrants | Netherlands | 97.8 /100 | #68 | Exceptional 12.2% |
| Swiss | 97.7 /100 | #69 | Exceptional 12.2% |
| Immigrants | Belgium | 97.7 /100 | #70 | Exceptional 12.2% |
| Carpatho Rusyns | 97.6 /100 | #71 | Exceptional 12.2% |
| Cambodians | 97.5 /100 | #72 | Exceptional 12.2% |
| Zimbabweans | 97.5 /100 | #73 | Exceptional 12.3% |
| Immigrants | Canada | 97.5 /100 | #74 | Exceptional 12.3% |
| Europeans | 97.4 /100 | #75 | Exceptional 12.3% |