Scottish vs Immigrants from Netherlands Median Family Income
COMPARE
Scottish
Immigrants from Netherlands
Median Family Income
Median Family Income Comparison
Scottish
Immigrants from Netherlands
$104,288
MEDIAN FAMILY INCOME
69.5/ 100
METRIC RATING
160th/ 347
METRIC RANK
$114,987
MEDIAN FAMILY INCOME
99.8/ 100
METRIC RATING
59th/ 347
METRIC RANK
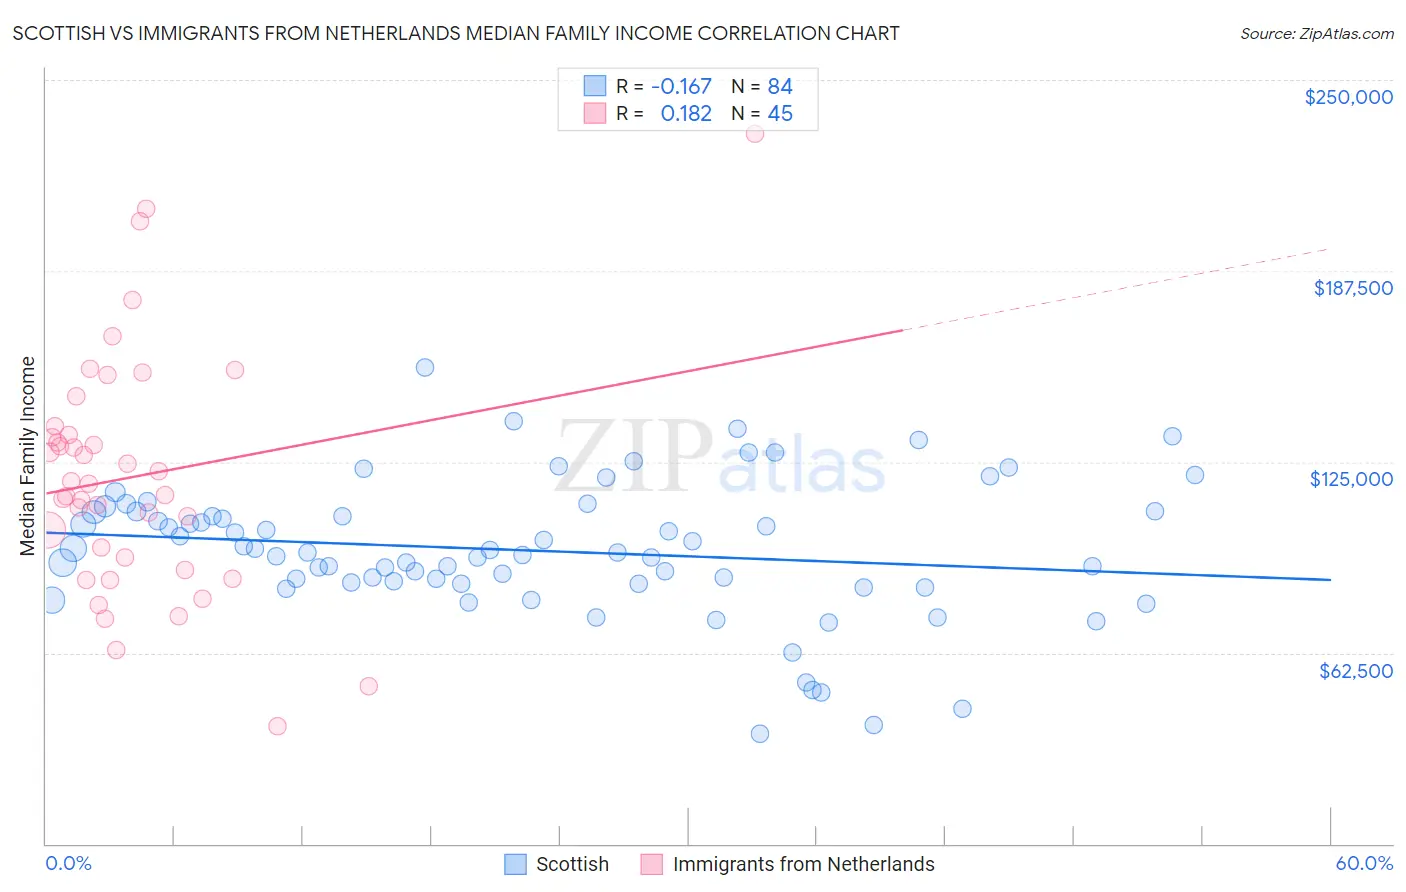
Scottish vs Immigrants from Netherlands Median Family Income Correlation Chart
The statistical analysis conducted on geographies consisting of 565,809,702 people shows a poor negative correlation between the proportion of Scottish and median family income in the United States with a correlation coefficient (R) of -0.167 and weighted average of $104,288. Similarly, the statistical analysis conducted on geographies consisting of 237,758,558 people shows a poor positive correlation between the proportion of Immigrants from Netherlands and median family income in the United States with a correlation coefficient (R) of 0.182 and weighted average of $114,987, a difference of 10.3%.
Median Family Income Correlation Summary
| Measurement | Scottish | Immigrants from Netherlands |
| Minimum | $35,833 | $38,500 |
| Maximum | $155,822 | $232,557 |
| Range | $119,989 | $194,057 |
| Mean | $95,991 | $120,210 |
| Median | $95,418 | $117,794 |
| Interquartile 25% (IQ1) | $85,332 | $91,744 |
| Interquartile 75% (IQ3) | $108,630 | $135,100 |
| Interquartile Range (IQR) | $23,298 | $43,356 |
| Standard Deviation (Sample) | $22,327 | $39,370 |
| Standard Deviation (Population) | $22,194 | $38,930 |
Similar Demographics by Median Family Income
Demographics Similar to Scottish by Median Family Income
In terms of median family income, the demographic groups most similar to Scottish are Icelander ($104,282, a difference of 0.010%), Swiss ($104,396, a difference of 0.10%), Scandinavian ($104,410, a difference of 0.12%), Moroccan ($104,488, a difference of 0.19%), and Immigrants from Sierra Leone ($103,990, a difference of 0.29%).
| Demographics | Rating | Rank | Median Family Income |
| Slavs | 77.9 /100 | #153 | Good $105,144 |
| Immigrants | Nepal | 76.3 /100 | #154 | Good $104,966 |
| Native Hawaiians | 75.8 /100 | #155 | Good $104,910 |
| Basques | 74.4 /100 | #156 | Good $104,760 |
| Moroccans | 71.6 /100 | #157 | Good $104,488 |
| Scandinavians | 70.8 /100 | #158 | Good $104,410 |
| Swiss | 70.7 /100 | #159 | Good $104,396 |
| Scottish | 69.5 /100 | #160 | Good $104,288 |
| Icelanders | 69.4 /100 | #161 | Good $104,282 |
| Immigrants | Sierra Leone | 66.2 /100 | #162 | Good $103,990 |
| Costa Ricans | 66.2 /100 | #163 | Good $103,989 |
| Sierra Leoneans | 64.7 /100 | #164 | Good $103,859 |
| Slovaks | 63.1 /100 | #165 | Good $103,729 |
| English | 62.6 /100 | #166 | Good $103,684 |
| South American Indians | 61.9 /100 | #167 | Good $103,624 |
Demographics Similar to Immigrants from Netherlands by Median Family Income
In terms of median family income, the demographic groups most similar to Immigrants from Netherlands are Immigrants from Latvia ($114,826, a difference of 0.14%), Immigrants from Indonesia ($115,162, a difference of 0.15%), Greek ($115,192, a difference of 0.18%), New Zealander ($115,230, a difference of 0.21%), and Lithuanian ($115,395, a difference of 0.35%).
| Demographics | Rating | Rank | Median Family Income |
| Maltese | 99.9 /100 | #52 | Exceptional $115,862 |
| Immigrants | Norway | 99.9 /100 | #53 | Exceptional $115,847 |
| Immigrants | Europe | 99.9 /100 | #54 | Exceptional $115,523 |
| Lithuanians | 99.8 /100 | #55 | Exceptional $115,395 |
| New Zealanders | 99.8 /100 | #56 | Exceptional $115,230 |
| Greeks | 99.8 /100 | #57 | Exceptional $115,192 |
| Immigrants | Indonesia | 99.8 /100 | #58 | Exceptional $115,162 |
| Immigrants | Netherlands | 99.8 /100 | #59 | Exceptional $114,987 |
| Immigrants | Latvia | 99.8 /100 | #60 | Exceptional $114,826 |
| Immigrants | Belarus | 99.8 /100 | #61 | Exceptional $114,586 |
| Mongolians | 99.8 /100 | #62 | Exceptional $114,553 |
| Immigrants | Pakistan | 99.8 /100 | #63 | Exceptional $114,406 |
| Immigrants | Scotland | 99.7 /100 | #64 | Exceptional $114,392 |
| Egyptians | 99.7 /100 | #65 | Exceptional $114,119 |
| Paraguayans | 99.7 /100 | #66 | Exceptional $114,016 |