Scottish vs Immigrants from Netherlands 7th Grade
COMPARE
Scottish
Immigrants from Netherlands
7th Grade
7th Grade Comparison
Scottish
Immigrants from Netherlands
97.5%
7TH GRADE
100.0/ 100
METRIC RATING
17th/ 347
METRIC RANK
96.8%
7TH GRADE
99.3/ 100
METRIC RATING
78th/ 347
METRIC RANK
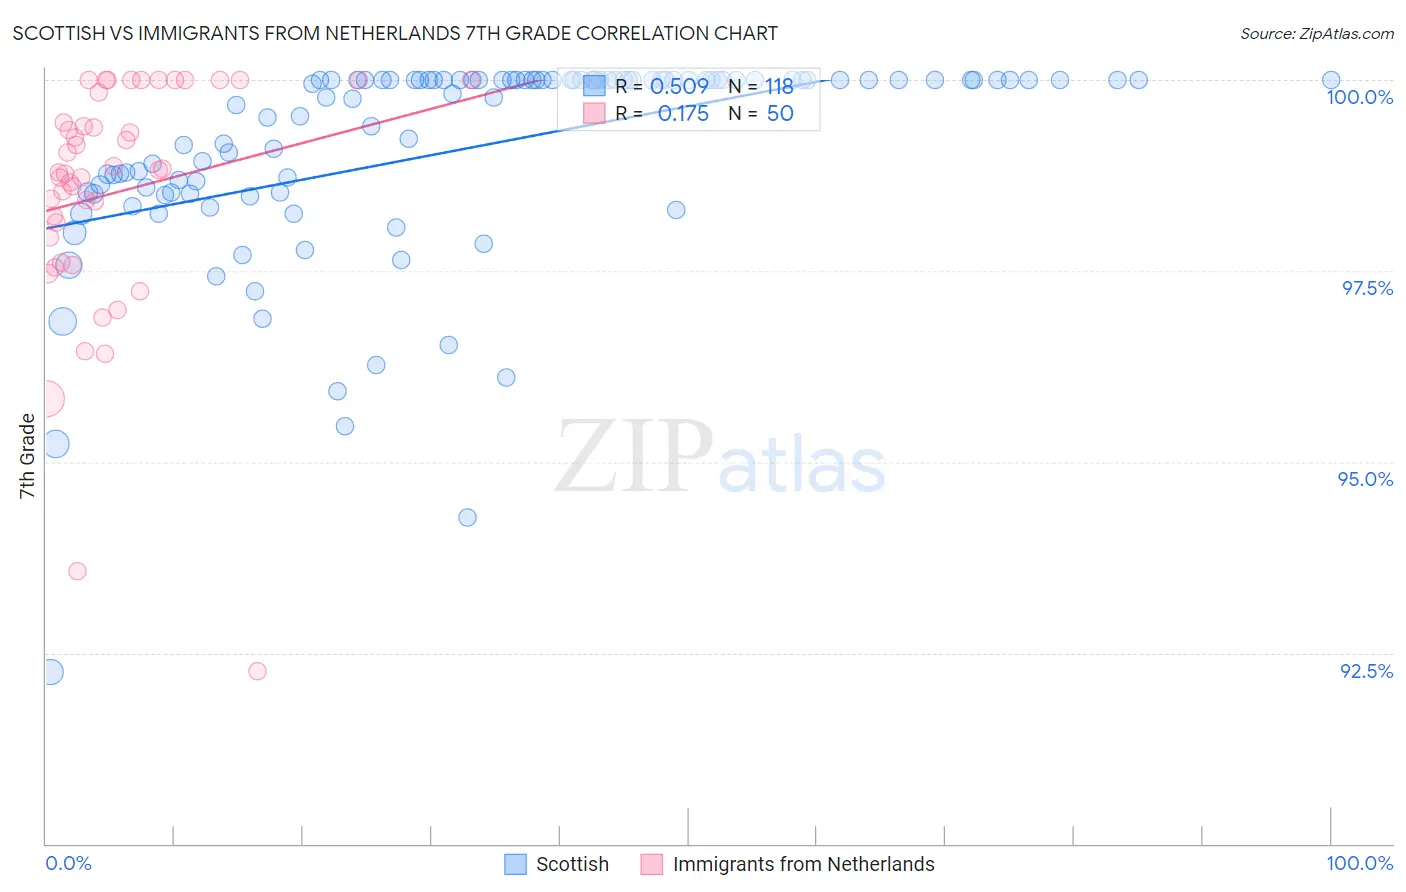
Scottish vs Immigrants from Netherlands 7th Grade Correlation Chart
The statistical analysis conducted on geographies consisting of 567,141,733 people shows a substantial positive correlation between the proportion of Scottish and percentage of population with at least 7th grade education in the United States with a correlation coefficient (R) of 0.509 and weighted average of 97.5%. Similarly, the statistical analysis conducted on geographies consisting of 237,869,934 people shows a poor positive correlation between the proportion of Immigrants from Netherlands and percentage of population with at least 7th grade education in the United States with a correlation coefficient (R) of 0.175 and weighted average of 96.8%, a difference of 0.76%.
7th Grade Correlation Summary
| Measurement | Scottish | Immigrants from Netherlands |
| Minimum | 92.2% | 92.3% |
| Maximum | 100.0% | 100.0% |
| Range | 7.8% | 7.7% |
| Mean | 99.1% | 98.5% |
| Median | 100.0% | 98.8% |
| Interquartile 25% (IQ1) | 98.5% | 97.9% |
| Interquartile 75% (IQ3) | 100.0% | 99.8% |
| Interquartile Range (IQR) | 1.5% | 1.9% |
| Standard Deviation (Sample) | 1.4% | 1.6% |
| Standard Deviation (Population) | 1.4% | 1.6% |
Similar Demographics by 7th Grade
Demographics Similar to Scottish by 7th Grade
In terms of 7th grade, the demographic groups most similar to Scottish are Irish (97.5%, a difference of 0.010%), Tlingit-Haida (97.5%, a difference of 0.010%), Lithuanian (97.5%, a difference of 0.020%), Yup'ik (97.4%, a difference of 0.060%), and English (97.6%, a difference of 0.070%).
| Demographics | Rating | Rank | 7th Grade |
| Slovenes | 100.0 /100 | #10 | Exceptional 97.6% |
| Alaskan Athabascans | 100.0 /100 | #11 | Exceptional 97.6% |
| Poles | 100.0 /100 | #12 | Exceptional 97.6% |
| Swedes | 100.0 /100 | #13 | Exceptional 97.6% |
| Pennsylvania Germans | 100.0 /100 | #14 | Exceptional 97.6% |
| English | 100.0 /100 | #15 | Exceptional 97.6% |
| Irish | 100.0 /100 | #16 | Exceptional 97.5% |
| Scottish | 100.0 /100 | #17 | Exceptional 97.5% |
| Tlingit-Haida | 100.0 /100 | #18 | Exceptional 97.5% |
| Lithuanians | 100.0 /100 | #19 | Exceptional 97.5% |
| Yup'ik | 100.0 /100 | #20 | Exceptional 97.4% |
| Inupiat | 100.0 /100 | #21 | Exceptional 97.4% |
| French Canadians | 100.0 /100 | #22 | Exceptional 97.4% |
| Croatians | 100.0 /100 | #23 | Exceptional 97.4% |
| Welsh | 100.0 /100 | #24 | Exceptional 97.4% |
Demographics Similar to Immigrants from Netherlands by 7th Grade
In terms of 7th grade, the demographic groups most similar to Immigrants from Netherlands are Cypriot (96.8%, a difference of 0.0%), Yugoslavian (96.8%, a difference of 0.0%), Immigrants from Ireland (96.8%, a difference of 0.010%), Cherokee (96.8%, a difference of 0.010%), and Delaware (96.8%, a difference of 0.020%).
| Demographics | Rating | Rank | 7th Grade |
| Immigrants | Lithuania | 99.6 /100 | #71 | Exceptional 96.8% |
| Cajuns | 99.5 /100 | #72 | Exceptional 96.8% |
| Arapaho | 99.5 /100 | #73 | Exceptional 96.8% |
| Immigrants | England | 99.5 /100 | #74 | Exceptional 96.8% |
| Zimbabweans | 99.5 /100 | #75 | Exceptional 96.8% |
| Immigrants | Ireland | 99.4 /100 | #76 | Exceptional 96.8% |
| Cherokee | 99.4 /100 | #77 | Exceptional 96.8% |
| Immigrants | Netherlands | 99.3 /100 | #78 | Exceptional 96.8% |
| Cypriots | 99.3 /100 | #79 | Exceptional 96.8% |
| Yugoslavians | 99.3 /100 | #80 | Exceptional 96.8% |
| Delaware | 99.2 /100 | #81 | Exceptional 96.8% |
| Chickasaw | 99.2 /100 | #82 | Exceptional 96.7% |
| Icelanders | 99.1 /100 | #83 | Exceptional 96.7% |
| Romanians | 99.1 /100 | #84 | Exceptional 96.7% |
| Kiowa | 99.1 /100 | #85 | Exceptional 96.7% |