Scottish vs Immigrants from Netherlands Single Female Poverty
COMPARE
Scottish
Immigrants from Netherlands
Single Female Poverty
Single Female Poverty Comparison
Scottish
Immigrants from Netherlands
21.8%
SINGLE FEMALE POVERTY
7.3/ 100
METRIC RATING
223rd/ 347
METRIC RANK
20.0%
SINGLE FEMALE POVERTY
96.0/ 100
METRIC RATING
112th/ 347
METRIC RANK
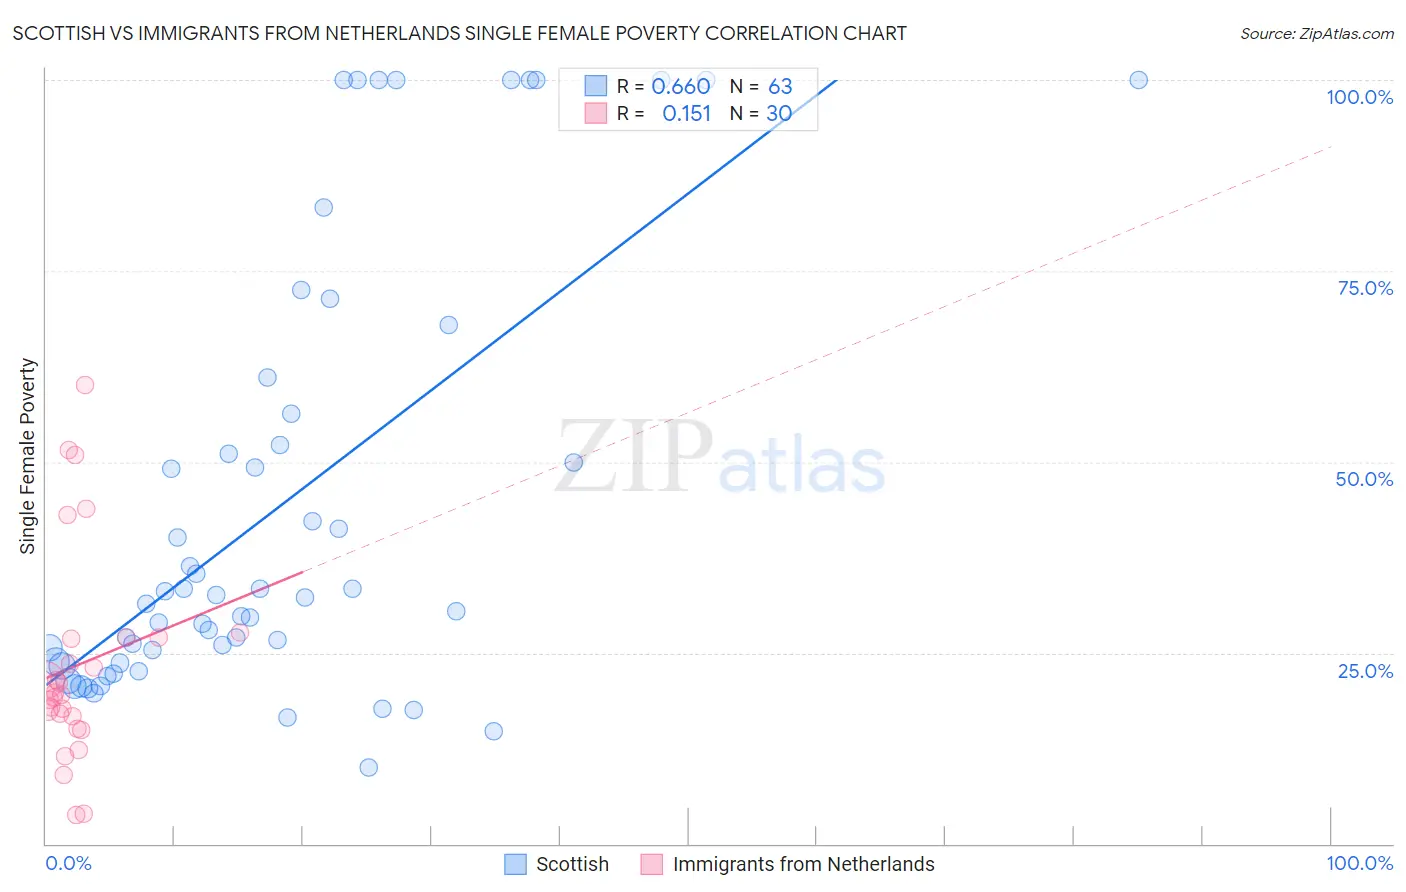
Scottish vs Immigrants from Netherlands Single Female Poverty Correlation Chart
The statistical analysis conducted on geographies consisting of 546,834,351 people shows a significant positive correlation between the proportion of Scottish and poverty level among single females in the United States with a correlation coefficient (R) of 0.660 and weighted average of 21.8%. Similarly, the statistical analysis conducted on geographies consisting of 234,903,097 people shows a poor positive correlation between the proportion of Immigrants from Netherlands and poverty level among single females in the United States with a correlation coefficient (R) of 0.151 and weighted average of 20.0%, a difference of 9.4%.
Single Female Poverty Correlation Summary
| Measurement | Scottish | Immigrants from Netherlands |
| Minimum | 10.0% | 3.8% |
| Maximum | 100.0% | 60.0% |
| Range | 90.0% | 56.2% |
| Mean | 44.2% | 23.4% |
| Median | 32.2% | 19.7% |
| Interquartile 25% (IQ1) | 23.7% | 16.7% |
| Interquartile 75% (IQ3) | 56.2% | 27.0% |
| Interquartile Range (IQR) | 32.6% | 10.4% |
| Standard Deviation (Sample) | 28.5% | 13.6% |
| Standard Deviation (Population) | 28.3% | 13.4% |
Similar Demographics by Single Female Poverty
Demographics Similar to Scottish by Single Female Poverty
In terms of single female poverty, the demographic groups most similar to Scottish are Barbadian (21.8%, a difference of 0.020%), Immigrants from Eritrea (21.8%, a difference of 0.14%), Immigrants from Grenada (21.8%, a difference of 0.15%), English (21.9%, a difference of 0.20%), and German (21.8%, a difference of 0.21%).
| Demographics | Rating | Rank | Single Female Poverty |
| Immigrants | Barbados | 12.2 /100 | #216 | Poor 21.7% |
| Immigrants | St. Vincent and the Grenadines | 11.7 /100 | #217 | Poor 21.7% |
| Nepalese | 9.7 /100 | #218 | Tragic 21.7% |
| Panamanians | 9.4 /100 | #219 | Tragic 21.7% |
| Germans | 8.3 /100 | #220 | Tragic 21.8% |
| Immigrants | Grenada | 8.0 /100 | #221 | Tragic 21.8% |
| Immigrants | Eritrea | 7.9 /100 | #222 | Tragic 21.8% |
| Scottish | 7.3 /100 | #223 | Tragic 21.8% |
| Barbadians | 7.2 /100 | #224 | Tragic 21.8% |
| English | 6.4 /100 | #225 | Tragic 21.9% |
| Immigrants | Portugal | 5.8 /100 | #226 | Tragic 21.9% |
| Immigrants | Ghana | 5.8 /100 | #227 | Tragic 21.9% |
| Salvadorans | 5.5 /100 | #228 | Tragic 21.9% |
| Tlingit-Haida | 5.4 /100 | #229 | Tragic 21.9% |
| Immigrants | Western Africa | 5.3 /100 | #230 | Tragic 22.0% |
Demographics Similar to Immigrants from Netherlands by Single Female Poverty
In terms of single female poverty, the demographic groups most similar to Immigrants from Netherlands are Immigrants from Zimbabwe (20.0%, a difference of 0.050%), Carpatho Rusyn (20.0%, a difference of 0.060%), Immigrants from Colombia (20.0%, a difference of 0.060%), Immigrants from Northern Africa (20.0%, a difference of 0.070%), and Immigrants from Kazakhstan (20.0%, a difference of 0.11%).
| Demographics | Rating | Rank | Single Female Poverty |
| Israelis | 96.9 /100 | #105 | Exceptional 19.9% |
| Ethiopians | 96.7 /100 | #106 | Exceptional 19.9% |
| Immigrants | Syria | 96.7 /100 | #107 | Exceptional 19.9% |
| Native Hawaiians | 96.6 /100 | #108 | Exceptional 19.9% |
| Colombians | 96.6 /100 | #109 | Exceptional 19.9% |
| Immigrants | Western Asia | 96.5 /100 | #110 | Exceptional 19.9% |
| Carpatho Rusyns | 96.1 /100 | #111 | Exceptional 20.0% |
| Immigrants | Netherlands | 96.0 /100 | #112 | Exceptional 20.0% |
| Immigrants | Zimbabwe | 95.9 /100 | #113 | Exceptional 20.0% |
| Immigrants | Colombia | 95.9 /100 | #114 | Exceptional 20.0% |
| Immigrants | Northern Africa | 95.8 /100 | #115 | Exceptional 20.0% |
| Immigrants | Kazakhstan | 95.7 /100 | #116 | Exceptional 20.0% |
| Poles | 95.6 /100 | #117 | Exceptional 20.0% |
| Immigrants | Afghanistan | 95.4 /100 | #118 | Exceptional 20.0% |
| Immigrants | Ethiopia | 95.4 /100 | #119 | Exceptional 20.0% |